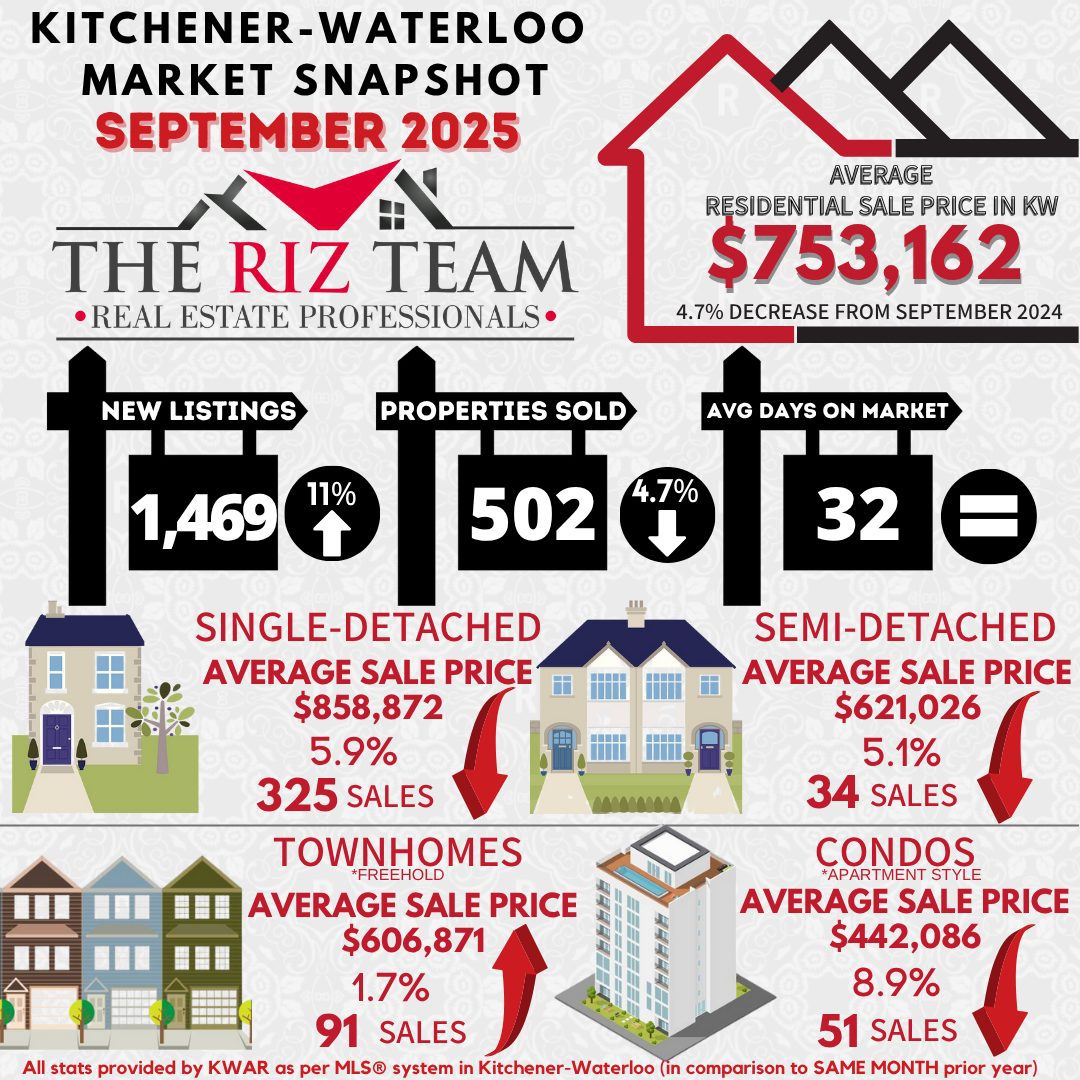
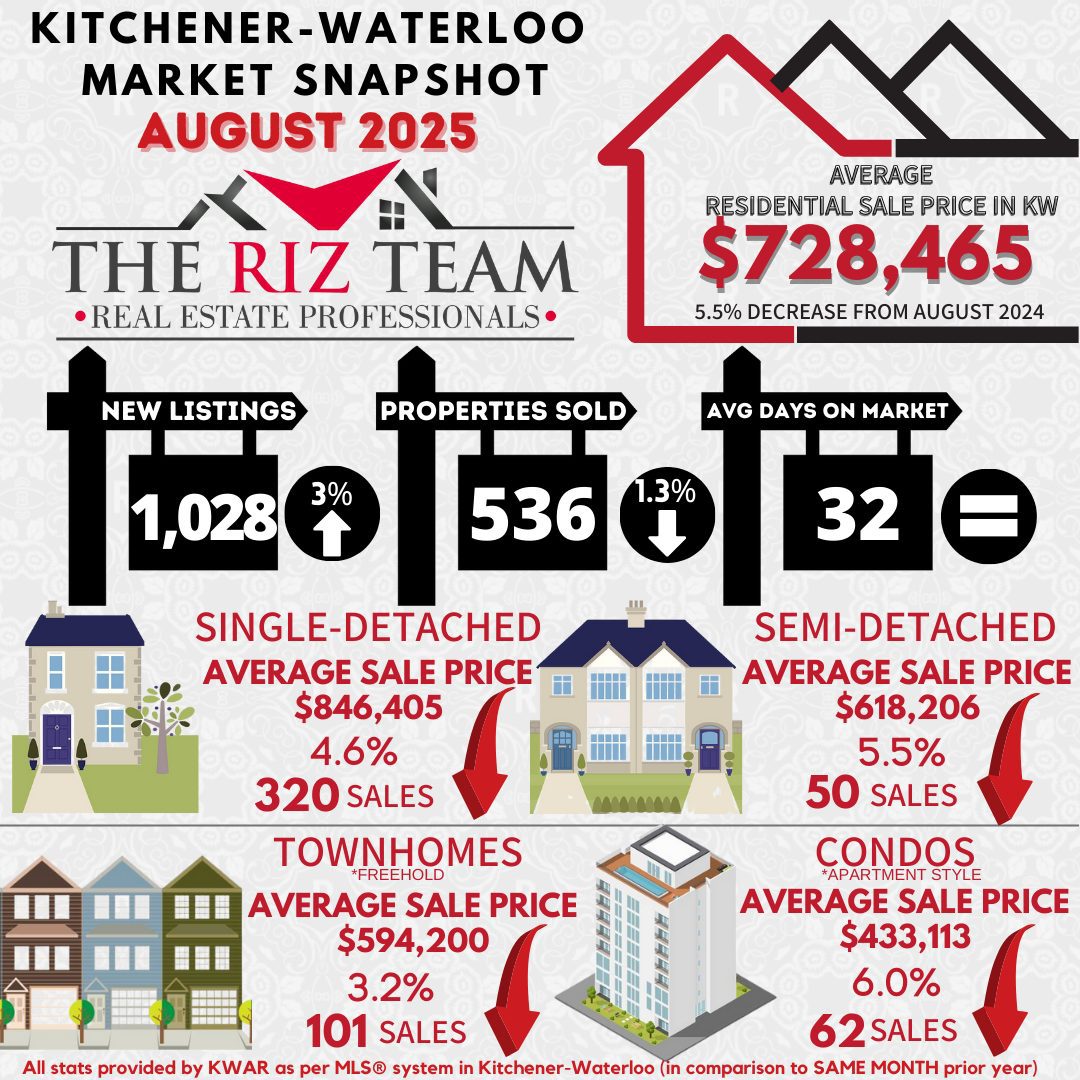
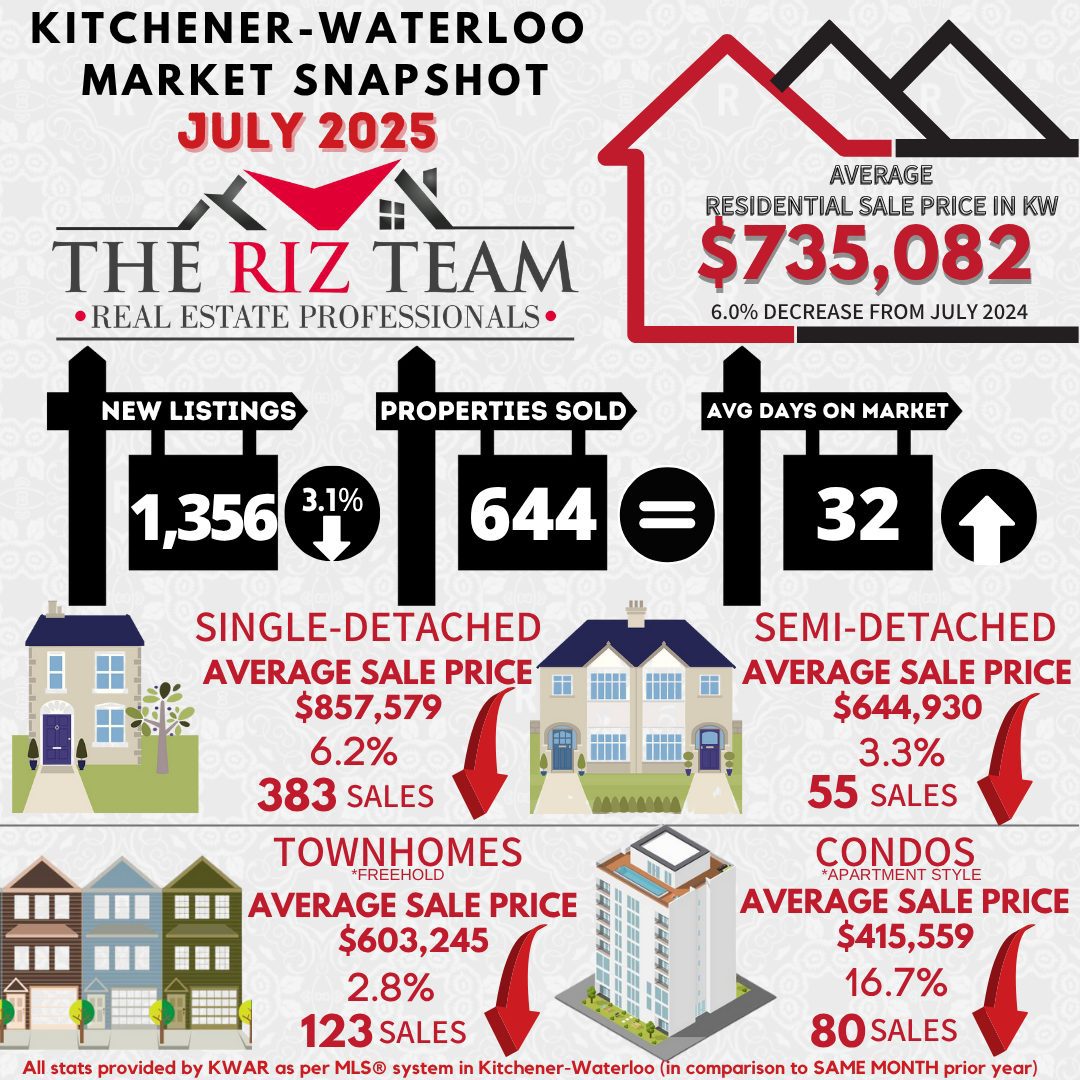
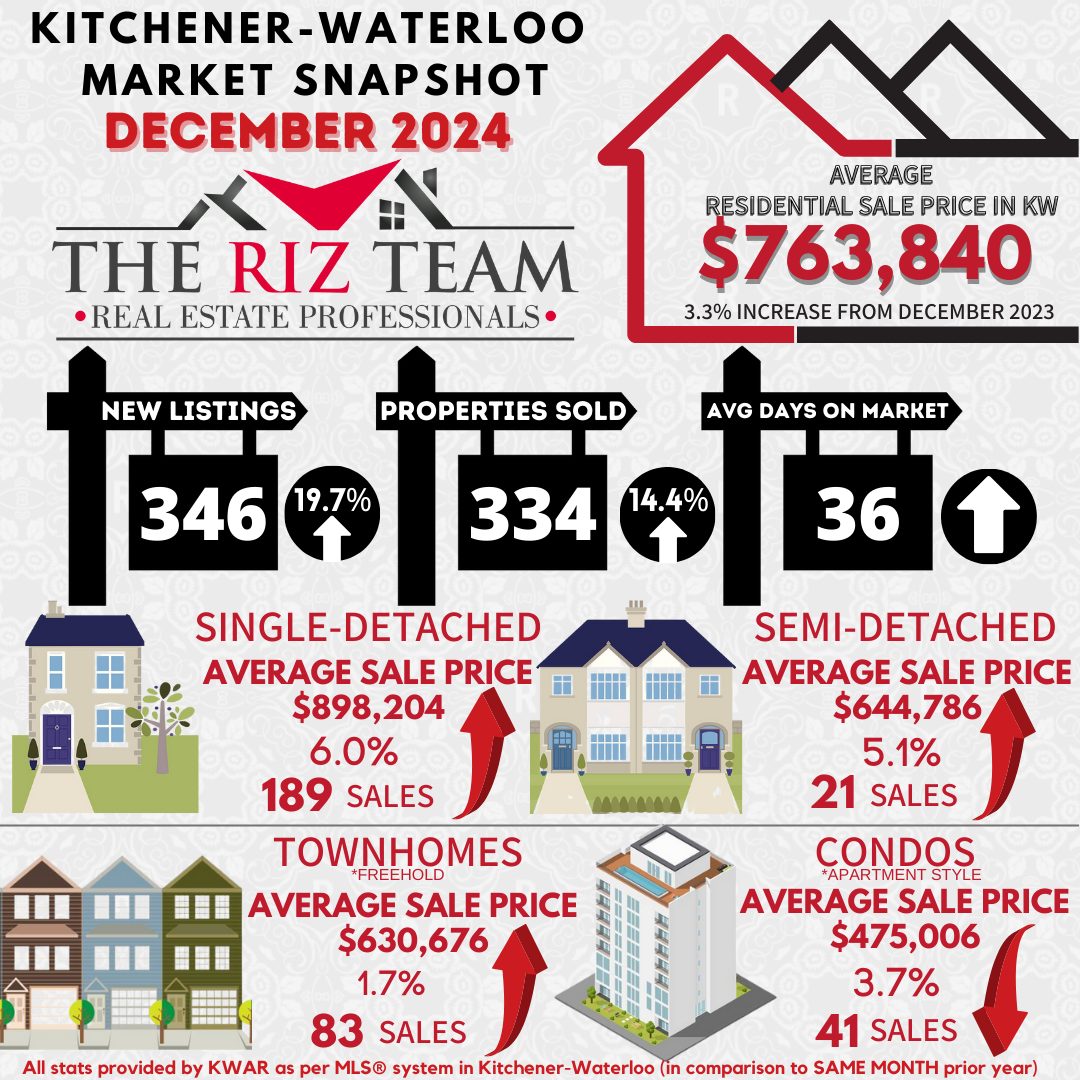
The Riz Team Blog

Posts Tagged ‘KW Real Estate’

Kitchener Waterloo Market Snapshot November 2024

Wednesday, December 4th, 2024

November Home Sales in Waterloo Region Up Over Last Year

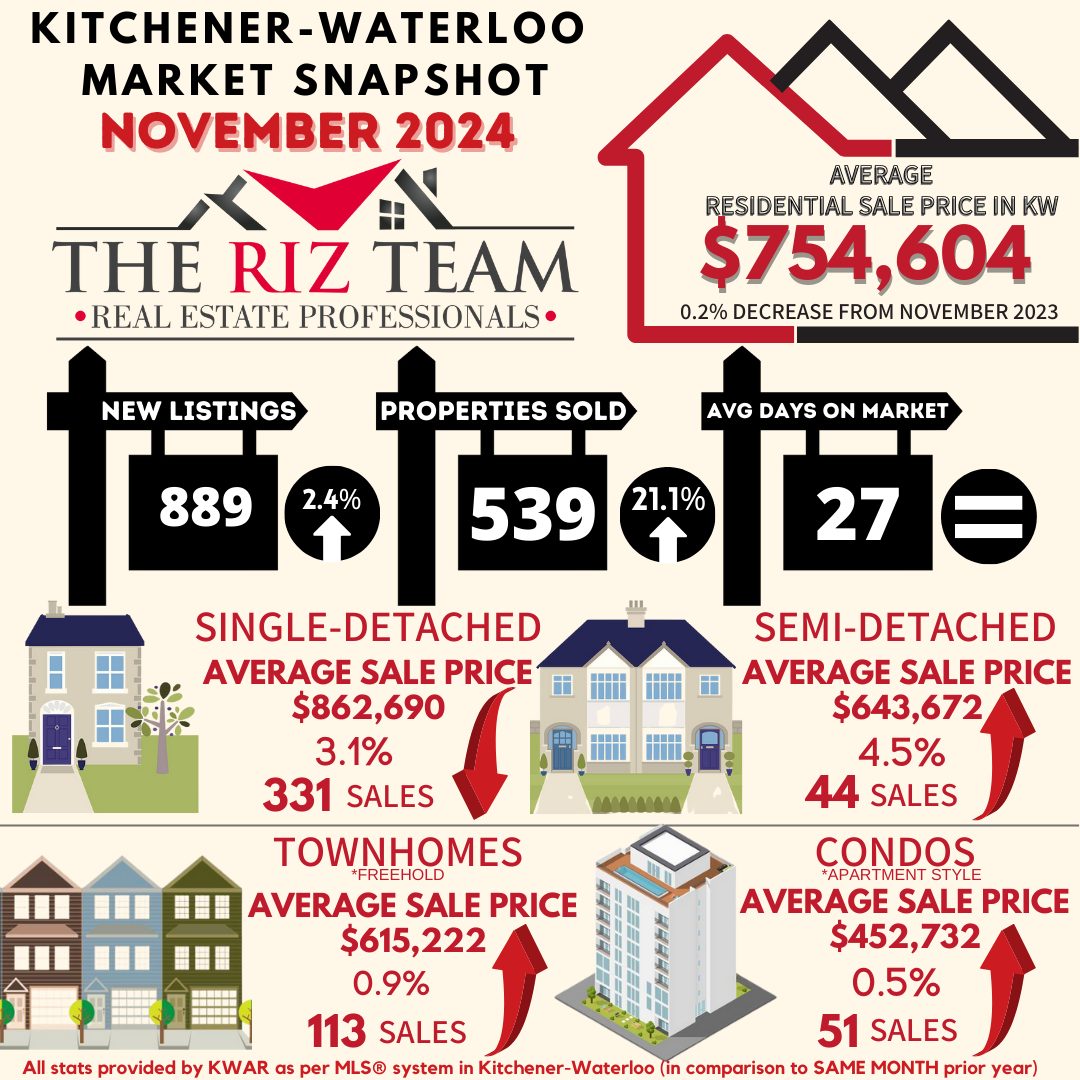
In November, a total of 539 homes were sold in the Waterloo Region via the Multiple Listing Service® (MLS®) System of the Cornerstone Association of REALTORS® (Cornerstone). This represents a 21.1 per cent increase compared to the same period last year and a decline of 13.1 per cent compared to the average number of homes sold in the previous ten years for the same month.

“Home sales in the Waterloo Region experienced a substantial increase in November compared to last year. However, sales were down from the previous month and remain below the historical averages for the area,” said Christal Moura, spokesperson for the Waterloo Region market. “November has shown more balanced conditions, and the increase in available homes has benefited buyers, giving them more options.”

If you are considering to Sell your home or Buy a home in the next short while it would be highly beneficial for you to connect with one of our Team Agents at


The Riz Team

Do you want to know what your home is worth today? Click Below for our Online No Obligation Market EvaluationClick Here

Total residential sales in November included 331 detached homes (up 23.5 per cent from November 2023), and 113 townhouses (up 37.8 per cent). Sales also included 51 condominium units (down 17.7 per cent) and 44 semi-detached homes (up 37.5 per cent).

In November, the average sale price for all residential properties in Waterloo Region was $754,604. This represents a 0.2 per cent decrease compared to November 2023 and a 3.3 per cent decrease compared to October 2024.

  • The average price of a detached home was $862,690. This represents a 3.1per cent decrease from November 2023 and a decrease of 2.6 per cent compared to October 2024.
  • The average sale price for a townhouse was $615,222. This represents a 0.9 per cent increase from November 2023 and a decrease of 4.9 per cent compared to October 2024.
  • The average sale price for an apartment-style condominium was $452,732. This represents a 0.5 per cent increase from November 2023 and a decrease of 6.2 per cent compared to October 2024.
  • The average sale price for a semi was $643,672. This represents an increase of 4.5 per cent compared to November 2023 and a decrease of 1.0 per cent compared to October 2024.

01.WaterlooRegionPriceChart_11.2024

MLS® Home Price Index Benchmark Price

  Kitchener-Waterloo Cambridge
Benchmark Type: November 2024 Monthly % Change Yr./Yr. % Change November 2024 Monthly % Change Yr./Yr. % Change
Composite $719,600 0.8 0.6 $737,400 -0.1 1.6
Single Family $828,900 0.9 2.1 $775,000 -0.1 3.3
Townhouse $592,300 -0.4 -4.9 $626,700 -0.3 -5.3
Apartment $444,300 1.1 -2.4 $479,600 -0.2 -3.3


November 2024 HPI image for stats release

“Current market conditions, marked by increased inventory and stable prices, suggest that now might be a good time to buy,” says Moura. “This is especially true for those who can take advantage of lower interest rates and recent mortgage reforms. These reforms expand eligibility for 30-year mortgage amortizations to all first-time homebuyers and buyers of new construction. Additionally, a higher limit on insured mortgages will take effect on December 15, 2024.”

There were 889 new listings added to the MLS® System in Waterloo Region last month, an increase of 2.4 per cent compared to November last year and an 18.4 per cent increase compared to the previous ten-year average for November.

The total number of homes available for sale in active status at the end of November was 1,565 an increase of 20.0 per cent compared to November of last year and 57.8 per cent above the previous ten-year average of 992 listings for November.

The total inventory across the market increased by 16.7 percent, resulting in a 2.8 month supply of all property types by the end of November. Condominium apartments had the highest inventory, with 5.9 months’ supply, followed by townhouses with 3.9 months’ supply and detached homes with 2.0 months’ supply. The number of months of inventory represents the time it would take to sell off current inventories at the current sales rate.
The average time to sell a home in November was 27 days, consistent with the previous month. In November 2023, it took 24 days for a home to sell, and the five-year average was 19 days.

Cornerstone emphasizes the importance of consulting a local REALTOR® when considering buying or selling property in the Waterloo Region. Their expertise can provide valuable insights into the current market conditions, enabling individuals to make well-informed decisions aligned with their goals and preferences.

View our HPI tool here to learn more: https://www.cornerstone.inc/stats/

02.Average Sales Price by Municipality_11.2024

03.Average Sale Price by Township_11.2024

04.Monthly Sales By Property Type_11.2024

05.Monthly Supply of Homes for Sale_11.2024

6.Monthly Supply of Homes for Sale – By Property Type_11.2024

07.Monthly Median Sales Price – By Property Type_11.2024

08.Monthly Average Sales Price – By Property Type.11.2024

09.Monthly Average Days on Market_11.2024

ABOUT CORNERSTONE

Cornerstone Association of REALTORS® (Cornerstone) is a brand-new, novel association formed on July 1, 2024. Representing REALTORS® serving in the markets of Mississauga, Burlington, Hamilton, Waterloo Region, Niagara North, Haldimand County, Norfolk County and surrounding areas, it will become Ontario’s second-largest real estate board comprised of nearly 9,000 REALTORS®.

Established to better serve and represent REALTORS®, its vision is to establish a new, more influential, capable, and member-centric organization designed to meet the evolving needs of REALTORS® and help them thrive in the marketplace.

Cornerstone stands for transparency, honesty, and integrity. By taking a proactive stance toward the future and not being afraid to question some of the long-standing assumptions, Cornerstone offers a unique value proposition, paving the way for members’ brighter future.

We are Cornerstone. REALTORS® Together, Stronger Together.

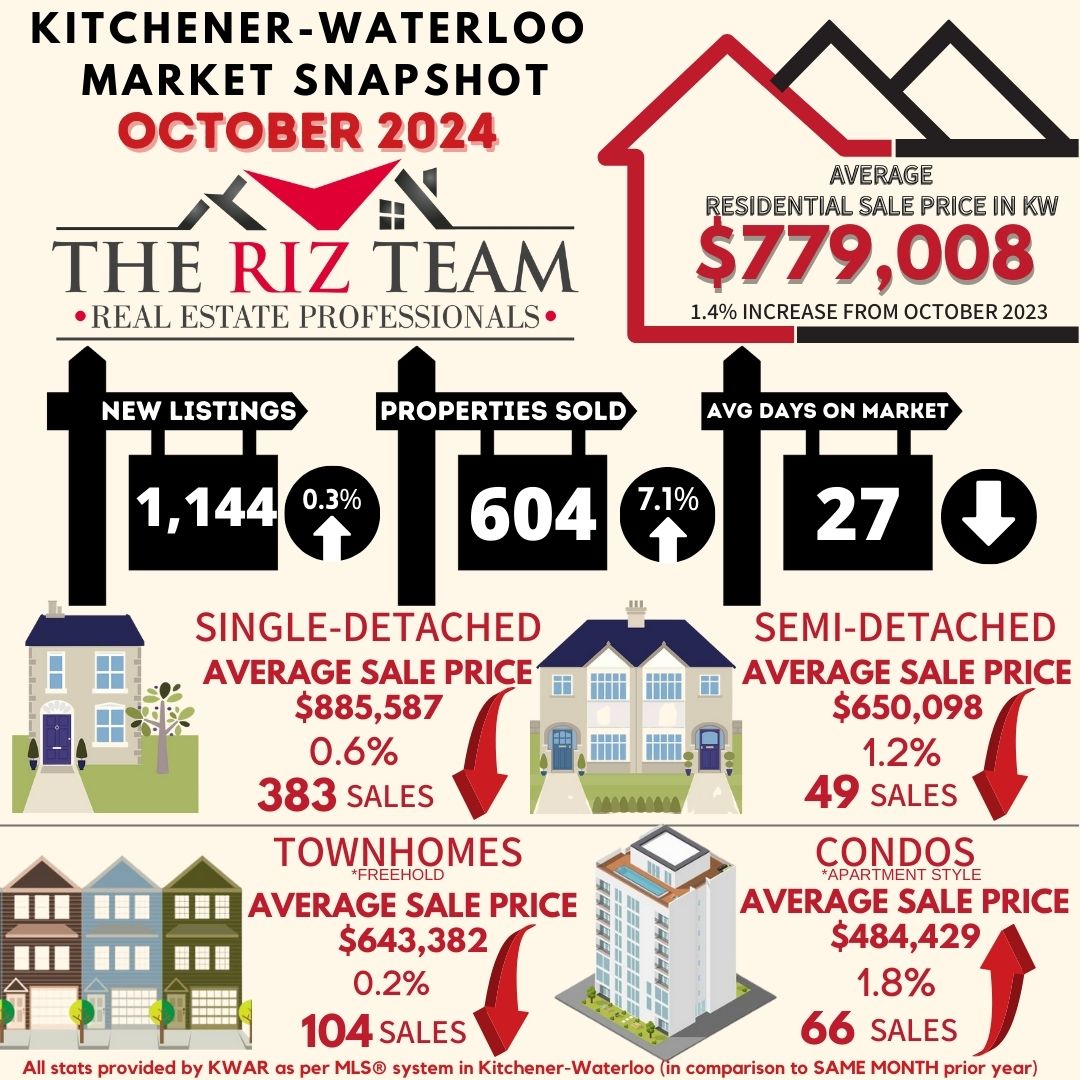
Kitchener Waterloo Market Snapshot October 2024

Monday, November 4th, 2024

Home Sales in the Waterloo Region Increased in October

In October, a total of 604 homes were sold in the Waterloo Region via the Multiple Listing Service® (MLS®) System of the Cornerstone Association of REALTORS® (Cornerstone). This represents a 7.1 per cent increase compared to the same period last year and a decline of 14.2 per cent compared to the average number of homes sold in the previous ten years for the same month.

“For the first time since May, we witnessed an encouraging rise in home sales throughout Waterloo Region last month,” stated Christal Moura, spokesperson for the Waterloo Region market area. “This positive trend reflects a shift toward more balanced conditions within our housing market and a renewed confidence among buyers.”

If you are considering to Sell your home or Buy a home in the next short while it would be highly beneficial for you to connect with one of our Team Agents at


The Riz Team

Do you want to know what your home is worth today? Click Below for our Online No Obligation Market EvaluationClick Here

Total residential sales in October included 383 detached homes (up 15.4 per cent from October 2023), and 104 townhouses (down 20.0 per cent). Sales also included 66 condominium units (up 1.5 per cent) and 49 semi-detached homes (up 53.1 per cent).

In October, the average sale price for all residential properties in Waterloo Region was $779,008. This represents a 1.4 per cent increase compared to October 2023 and a 1.4 per cent decrease compared to September 2024.

  • The average price of a detached home was $885,587. This represents a 0.6 per cent decrease from October 2023 and a decrease of 2.9 per cent compared to September 2024.
  • The average sale price for a townhouse was $643,382. This represents a 0.2 per cent decrease from October 2023 and an increase of 7.8 per cent compared to September 2024.
  • The average sale price for an apartment-style condominium was $484,429. This represents a 1.8 per cent increase from October 2023 and a decrease of 0.2 per cent compared to September 2024.
  • The average sale price for a semi was $650,098. This represents a decrease of 1.2 per cent compared to October 2023 and a decrease of 0.7 per cent compared to September 2024.

Average Sale Price – Monthly

CORNERSTONE cautions that average sale price information can help establish longterm trends but does not indicate specific properties have increased or decreased in value. The MLS® Home Price Index (HPI) provides the best way to gauge price trends because averages are strongly distorted by changes in the mix of sales activity from one month to the next.  

MLS® Home Price Index Benchmark Price

Kitchener-Waterloo Cambridge
Benchmark Type: October 2024 Monthly % Change Yr./Yr. % Change October 2024 Monthly % Change Yr./Yr. % Change
Composite $713,800 -2.1 -2.5 $738,400 -0.5 -1.8
Single Family $821,900 -2.7 -1.1 $775,900 -0.2 -0.6
Townhouse $594,500 -1.4 -5.8 $628,500 -2.0 -5.9
Apartment $439,500 0.9 -5.7 $480,400 -0.2 -4.3


On Wednesday, October 23, Cornerstone welcomed the news that the Bank of Canada cut its policy rate by 50 basis points to 3.75 per cent. This marks the fourth consecutive rate cut since June and is the most substantial decrease since March 2020.  Moura commented, “The interest rate cuts are certainly beneficial for those with variable mortgages and encouraging news for homeowners facing mortgage renewals. However, I believe many prospective home buyers may continue to wait for more significant reductions before making a move, especially with the anticipated mortgage reforms that come into effect on December 15, 2024.”

There were 1,144 new listings added to the MLS® System in Waterloo Region last month, an increase of 0.3 per cent compared to October last year and a 19.9 per cent increase compared to the previous ten-year average for October.

The total number of homes available for sale in active status at the end of October was 1,711 an increase of 21.0 per cent compared to October of last year and 48.5 per cent above the previous ten-year average of 1,153 listings for October.

The total inventory across the market increased by 19.2 percent, resulting in a 3.1-month supply of all property types by the end of October. Condominium apartments had the highest inventory, with 5.5 months’ supply, followed by townhouses with 3.8 months’ supply and detached homes with 2.5 months’ supply. The number of months of inventory represents the time it would take to sell off current inventories at the current sales rate.

The average time to sell a home in October was 27 days, one day shorter than the previous month. In October 2023, it took 21 days for a home to sell, and the five-year average is 18 days.

Cornerstone emphasizes the importance of consulting a local REALTOR® when considering buying or selling property in the Waterloo Region. Their expertise can provide valuable insights into the current market conditions, enabling individuals to make well-informed decisions aligned with their goals and preferences.

Click on any of the graphs below for an interactive view.

Kitchener Waterloo Market Snapshot September 2024

Thursday, October 3rd, 2024

Waterloo Region Sees Decrease in Home Sales for September

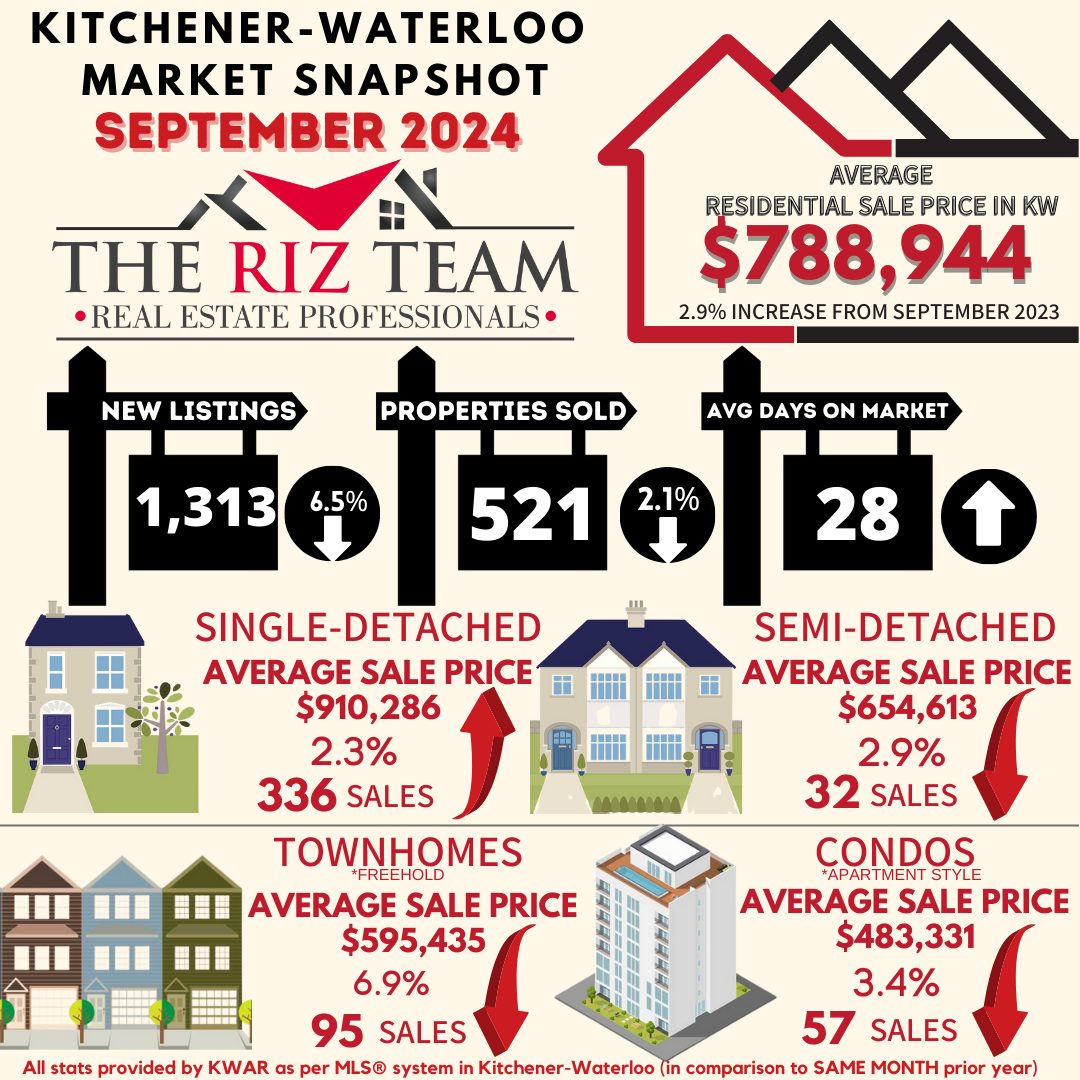
In September, a total of 521 homes were sold in the Waterloo Region via the Multiple Listing Service® (MLS®) System of the Cornerstone Association of REALTORS® (Cornerstone). This represents a decrease of 2.1 per cent compared to the same period last year and a decline of 23.5 per cent compared to the average number of homes sold in the previous ten years for the same month.

“In September, there was an overall slowdown in home sales, but we continued to see strong demand for detached homes, resulting in an increase in sales for that specific type of property,” said Christal Moura, spokesperson for the Waterloo Region market area. “Meanwhile, buyers have a bit more selection than a year ago as inventory is up, and homes take a little longer to sell. This can mean a less stressful homebuying experience, but for sellers, the current market may require more patience or even adjustment in price expectation.”

If you are considering to Sell your home or Buy a home in the next short while it would be highly beneficial for you to connect with one of our Team Agents at

The Riz Team

Do you want to know what your home is worth today? Click Below for our Online No Obligation Market EvaluationClick Here

Total residential sales in September included 336 detached homes (up 9.4 per cent from September 2023), and 95 townhouses (down 22.1 per cent). Sales also included 57 condominium units (down 16.2 per cent) and 32 semi-detached homes (down 3.0 per cent).

In September, the average sale price for all residential properties in Waterloo Region was $788,944. This represents a 2.9 per cent increase compared to September 2023 and a 2.3 per cent increase compared to August 2024.

  • The average price of a detached home was $910,286. This represents a 2.3 per cent increase from September 2023 and an increase of 2.2 per cent compared to August 2024.
  • The average sale price for a townhouse was $595,435. This represents a 6.9 per cent decrease from September 2023 and a decrease of 2.7 per cent compared to August 2024.
  • The average sale price for an apartment-style condominium was $483,331. This represents a decrease of 3.4 per cent from September 2023 and an increase of 4.9 per cent compared to August 2024.
  • The average sale price for a semi was $654,613. This represents a decrease of 2.9 per cent compared to September 2023 and an increase of 0.1 per cent compared to August 2024.

1B.September_Average_Sales-Monthly

MLS® Home Price Index Benchmark Price

Kitchener-Waterloo Cambridge
Benchmark Type: September 2024 Monthly % Change Yr./Yr. % Change September 2024 Monthly % Change Yr./Yr. % Change
Composite $728,700 0.2 -1.8 $741,800 -0.1 0.0
Single Family $844,400 0.6 0.3 $777,500 0.2 1.3
Townhouse $602,800 -0.7 -5.5 $641,700 -1.7 -4.8
Apartment $435,700 -1.3 -8.3 $481,500 -0.2 -4.2


September 2024 HPI Image for stats release

In September, Cornerstone welcomed policy changes from the federal government. These changes include extending mortgage terms to 30 years for first-time homebuyers and all buyers of new builds and raising the CMHC insurance cap from $1 million to $1.5 million. These changes will come into effect later this year. Combined with anticipated further interest rate cuts, these adjustments could enable more buyers to purchase their first home.

There were 1,313 new listings added to the MLS® System in Waterloo Region last month, a decrease of 6.5 per cent compared to September last year and a 20.0 per cent increase compared to the previous ten-year average for September.

The total number of homes available for sale in active status at the end of September was 1,751 an increase of 21.3 per cent compared to September of last year and 42.2 per cent above the previous ten-year average of 1,232 listings for September.

The total inventory across the market increased by 23.1 percent, resulting in a 3.2-month supply of all property types by the end of September. Condominium apartments had the highest inventory, with 5.5 months’ supply, followed by townhouses with 3.6 months’ supply and detached homes with 2.7 months’ supply. The number of months of inventory represents the time it would take to sell off current inventories at the current sales rate.

The average time it took to sell a home in September was 28 days, which is three days longer than the previous month. In September 2023, it took 19 days for a home to sell, and the five-year average is 18 days.

Cornerstone emphasizes the importance of consulting a local REALTOR® when considering buying or selling property in the Waterloo Region. Their expertise can provide valuable insights into the current market conditions, enabling individuals to make well-informed decisions aligned with their goals and preferences.

Average Sales Price – Municipality

2.BSeptember_Average_Sales-ByMunicipality

Average Sales Price – Township

3B.September_Average_Sales-ByTownship

Monthly Sales By Property Type


5B.September2024_Months-Supply-of_Homes-For-sale

6B.September2024_Monthly Supply of Homes for Sale – By Property Type
7B.September2024_Months Supply of home - by property type
9.September2024_Monthly Average Sales Price by Property Type
10.BSeptember2024_daysonmarket

Cornerstone Association of REALTORS® cautions that average sale price information can help identify long-term trends but should not be to indicate that specific properties have increased or decreased in value. The average sale price is calculated based on the total dollar volume of all properties sold. Months Supply is the inventory of homes for sale at the end of a given month, divided by the average monthly closed sales from the last 12 months. Those requiring specific information on property values should contact a Waterloo Region REALTOR®. REALTORS® have their fingers on the pulse of the market. They know the questions to ask, the areas to probe and what to look for so that you get a complete picture of the property and community you’re considering.

ABOUT CORNERSTONE

Cornerstone Association of REALTORS® (Cornerstone) is a brand-new, novel association formed on July 1, 2024. Representing REALTORS® serving in the markets of Mississauga, Burlington, Hamilton, Waterloo Region, Niagara North, Haldimand County, Norfolk County and surrounding areas, it will become Ontario’s second-largest real estate board comprised of nearly 9,000 REALTORS®.

Established to better serve and represent REALTORS®, its vision is to establish a new, more influential, capable, and member-centric organization designed to meet the evolving needs of REALTORS® and help them thrive in the marketplace.

Cornerstone stands for transparency, honesty, and integrity. By taking a proactive stance toward the future and not being afraid to question some of the long-standing assumptions, Cornerstone offers a unique value proposition, paving the way for members’ brighter future.

We are Cornerstone. REALTORS® Together, Stronger Together.

More information at www.cornerstone.inc 

Kitchener Waterloo Market Snapshot January 2023

Friday, February 3rd, 2023

Number of Home Sales in January Exceptionally Low

If you are considering to Sell your home or Buy a home in the next short while it would be highly beneficial for you to connect with one of our Team Agents at

The Riz Team

Do you want to know what your home is worth today? Click Below for our Online No Obligation Market EvaluationClick Here

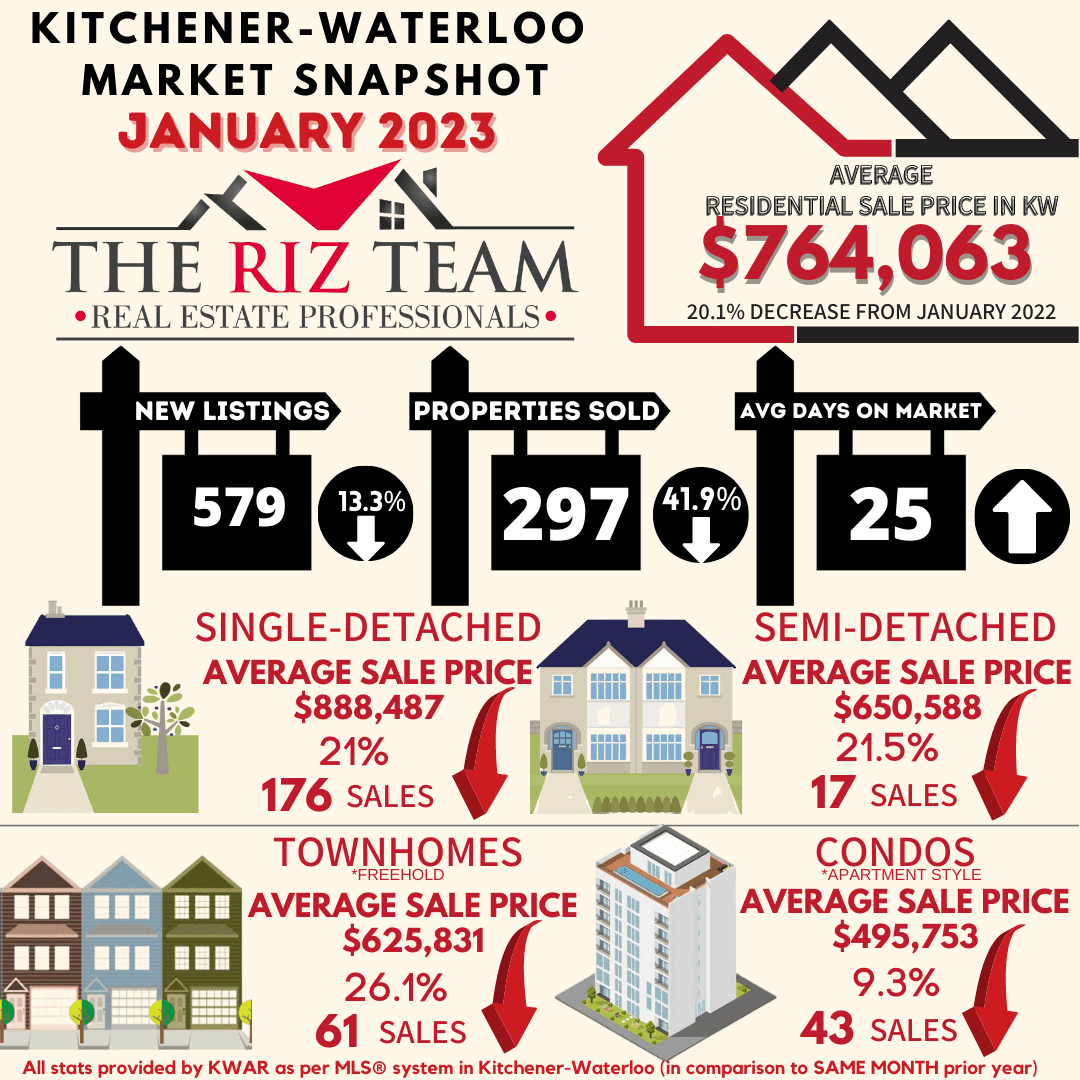
WATERLOO REGION, ON (February 3, 2023) —The number of homes sold last month through the Multiple Listing Service® (MLS®) System of the Waterloo Region Association of REALTORS® (WRAR) totalled 297 units, a decrease of 41.9 per cent compared to January 2022 and 31.0 per cent below the previous 5-year average for the month.

“Waterloo Region’s home sales in January were at their second lowest of any single month in well over a decade,” says Megan Bell, president of WRAR. “Home sales tend to be sluggish in January, and while we expected activity to ease to reflect economic challenges, this was a larger drop than originally anticipated.”

Total residential sales in January included 176 detached (down 38.5 per cent from January 2022), and 61 townhouses (down 44.5 per cent). Sales also included 43 condominium units (down 48.2 per cent) and 17 semi-detached homes (down 46.9 per cent).

In January, the average sale price for all residential properties in Waterloo Region was $764,063. This represents a 20.1 per cent decrease compared to January 2022 and a 5.9 per cent increase compared to December 2022.

  • The average price of a detached home was $888,487. This represents a 21.5 per cent decrease from January 2022 and an increase of 7.6 per cent compared to December 2022.
  • The average sale price for a townhouse was $625,831. This represents a 26.1 per cent decrease from January 2022 and an increase of 2.2 per cent compared to December 2022.
  • The average sale price for an apartment-style condominium was $495,753. This represents a decrease of 9.3 per cent from January 2022 and an increase of 6.1 per cent compared to December 2022.
  • The average sale price for a semi was $650,588. This represents a decrease of 21.5 per cent compared to January 2022 and an increase of 5.5 per cent compared to December 2022.
january average sales price by property type

WRAR cautions that average sale price information can be useful in establishing long-term trends but should not be used as an indicator that specific properties have increased or decreased in value. The MLS® Home Price Index (HPI) provides the best way to gauge price trends because averages are strongly distorted by changes in the mix of sales activity from one month to the next.

MLS® Home Price Index Benchmark Price

Kitchener-Waterloo Cambridge
Benchmark Type: January 2023 Monthly % Change Yr./Yr. % Change January 2023 Monthly % Change Yr./Yr. % Change
Composite $705,100 -1.2 -23.7

$731,000

2.4 -21.3
Detached $789,900 -1.4 -25.9 $757,200 2.9 -23.2
Townhouse $583,100 -1.8 -17.6 $638,300 -0.2 -8.0
Apartment $481,300 2.0 -5.1 $487,600 -1.9 -4.3

“On a monthly basis, we saw the average sale price increase across all property types in January,” says Bell. “I’m also noticing more multiple offers happening, especially on detached homes that are priced under eight hundred thousand dollars.”

Meanwhile, the Bank of Canada again increased interest rates at the end of January by 25 basis points to 4.5 per cent. “While not a huge increase, the continuance of interest rate hikes is an ongoing factor in the reduction of home sales within the market,” says Bell.

There were 579 new listings added to the MLS® System in Waterloo Region last month, a decrease of 13.3 per cent compared to January of last year and a 28.7 per cent decrease compared to the previous ten-year average for January.

The total number of homes available for sale in active status at the end of January was 651, an increase of 167.9 per cent compared to January of last year and 34.7 per cent below the previous ten-year average of 998 listings for January.

The number of months of inventory is up 233.3 per cent compared to January of last year, but still historically low at one month. Between 2011 and 2015, January’s average months of inventory was 3.0 months. The number of months of inventory represents how long it would take to sell off current inventories at the current sales rate.

The average number of days to sell in January was 25, compared to 9 days in January 2022. The previous 5-year average is 21 days.

WRAR’s president says, “The demographic of buyers is also shifting as we observe fewer buyers coming from the GTA into the region.  While there are still some, it is nowhere like it was last January. These and other shifting influences mean it has never been more important for buyers and sellers to work with a local REALTOR® to help provide expertise during the homebuying and selling process.”

Affordability, combined with ongoing supply constraints, makes it difficult for buyers to navigate the continuous market changes while sellers also need to adjust to the evolving circumstances. Those requiring specific information on property values should contact a local REALTOR®. Working with a Realtor is the best way to get a complete picture of the property and community you are considering.

View our HPI tool here to learn more: https://wrar.ca/hpi/

Click on any of the graphs below for an interactive view.

jan average sales prce
jan average sales townships
sales by property type
monthly supply of homes for sale
median sales price property type
average sales price by property type
average days on market

WRAR cautions that average sale price information can help identify long-term trends but should not be to indicate that specific properties have increased or decreased in value. The average sale price is calculated based on the total dollar volume of all properties sold. Months Supply is the inventory of homes for sale at the end of a given month, divided by the average monthly closed sales from the last 12 months. Those requiring specific information on property values should contact a Waterloo Region REALTOR®. REALTORS® have their fingers on the pulse of the market. They know the questions to ask, the areas to probe and what to look for so that you get a complete picture of the property and community you’re considering.


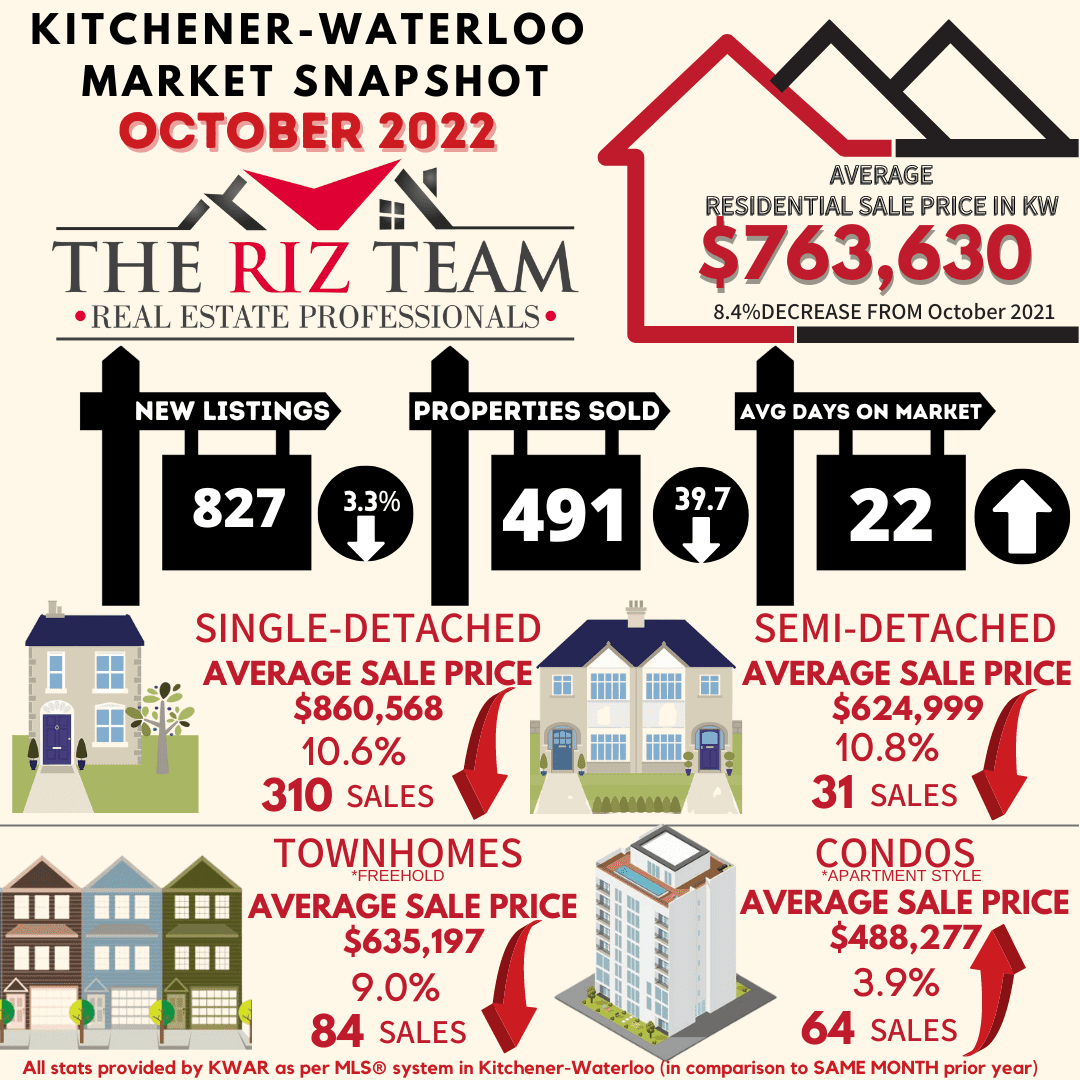
Kitchener Waterloo Market Snapshot October 2022

Wednesday, October 5th, 2022

Fewer Home Sales in October


“Unsurprisingly, the pace of home sales continued to slow in October after the Bank of Canada’s sixth straight interest rate hike in September,” says Megan Bell, President of WRAR. “Faced with higher borrowing costs, some buyers have had to re-assess what they can afford. As these buyers get moved to the sidelines, sellers question if now is the best possible time to sell.”


If you are considering to Sell your home or Buy a home in the next short while it would be highly beneficial for you to connect with one of our Team Agents at

The Riz Team

Do you want to know what your home is worth today? Click Below for our Online No Obligation Market EvaluationClick Here


WATERLOO REGION, ON (November 2, 2022) —491 residential homes were sold last month through the Multiple Listing Service® (MLS®) System of the Waterloo Region Association of REALTORS® (WRAR), a decrease of 39.7 per cent compared to October 2021 and 36.2 per cent below the previous 5-year average for the month.

Total residential sales in October included 310 detached (down 38.2 per cent from October 2021), and 84 townhouses (down 45.1 per cent). Sales also included 64 condominium units (down 36.0 per cent) and 31 semi-detached homes (down 47.5 per cent).

“Unsurprisingly, the pace of home sales continued to slow in October after the Bank of Canada’s sixth straight interest rate hike in September,” says Megan Bell, President of WRAR. “Faced with higher borrowing costs, some buyers have had to re-assess what they can afford. As these buyers get moved to the sidelines, sellers question if now is the best possible time to sell.”

In October, the average sale price for all residential properties in Waterloo Region was $763,630. This represents an 8.4 per cent decrease compared to October 2021 and a 1.6 per cent increase compared to September 2022.

  • The average price of a detached home was $860,568. This represents a 10.6 per cent decrease from October 2021 and a decrease of 0.3 per cent compared to September 2022.
  • The average sale price for a townhouse was $635,197. This represents a 9.0 per cent decrease from October 2021 and a decrease of 0.4 per cent compared to September 2022.
  • The average sale price for an apartment-style condominium was $488,277. This represents an increase of 3.9 per cent from October 2021 and an increase of 7.3 per cent compared to September 2022.
  • The average sale price for a semi was $624,999. This represents a decrease of 10.8 per cent compared to October 2021 and a decrease of 1.9 per cent compared to September 2022.
october 2022 average sales price by property type 2

WRAR cautions that average sale price information can be useful in establishing long-term trends but should not be used as an indicator that specific properties have increased or decreased in value. The MLS® Home Price Index (HPI) provides the best way to gauge price trends because averages are strongly distorted by changes in the mix of sales activity from one month to the next.

MLS® Home Price Index Benchmark Price

Kitchener-Waterloo Cambridge
Benchmark Type: October 2022 Monthly % Change Yr./Yr. % Change October 2022 Monthly % Change Yr./Yr. % Change
Composite $723,200 -0.2 -8.8 $730,700 -2.3 -9.8
Detached $807,900 -0.0 -10.1 $751,800 -2.1 -11.6
Townhouse $603,700 -1.3 -3.2 $663,100 -2.4 1.8
Apartment $494,400 -0.1 6.5 $520,100 -6.6 7.3


October 2022 HPI Stats Chart for Kitchener Waterloo Cambridge

“While there is uncertainty in the minds of consumers about current market conditions, one thing is for certain, Waterloo region’s housing supply remains one of the tightest in the country,” says Bell.  “Buyers may be on the sidelines for now due to affordability, but the underlying demand for housing remains strong.”

There were 827 new listings added to the MLS® System in the Waterloo Region last month, a decrease of 3.3 per cent compared to October of last year and a 14.3 per cent decrease compared to the previous ten-year average for October.

The total number of homes available for sale in active status at the end of October was 928, an increase of 134.9 per cent compared to October of last year and 34.9 per cent below the previous ten-year average of 1425 listings for October.

The number of months of inventory is up 160.0 per cent compared to October of last year, but still historically low at 1.3 months. Between 2009 and 2015, October’s average months of inventory was 3.6 months. The number of months of inventory represents how long it would take to sell off current inventories at the current sales rate.

The average number of days to sell in October was 22, compared to 10 days in October 2021. The previous 5-year average is 19 days.

Those requiring specific information on property values should contact a local REALTOR®.  Working with a Realtor is the best way to get a complete picture of the housing market, your particular property and the community you are considering.

View our HPI tool here to learn more: https://wrar.ca/hpi/

Click on any of the graphs below for an interactive view.

October-2022-average-sale-price-by-municipality
October 2022 average sale price by township
October 2022 sales by property type
October 2022 Months Supply
October 2022 median sales price by property type
October 2022 average sale price by property type
October 2022 average days on market

Kitchener Waterloo Market Snapshot August 2022

Wednesday, September 7th, 2022

Rising Borrowing Costs Continue to Tame Home Sales in August


“The decline was most pronounced in the apartment-style condo and townhouse categories which could indicate that rising borrowing costs are having a greater impact on first-time buyers and those looking for more affordable options.”   

If you are considering to Sell your home or Buy a home in the next short while it would be highly beneficial for you to connect with one of our Team Agents at

The Riz Team

Do you want to know what your home is worth today? Click Below for our Online No Obligation Market EvaluationClick Here

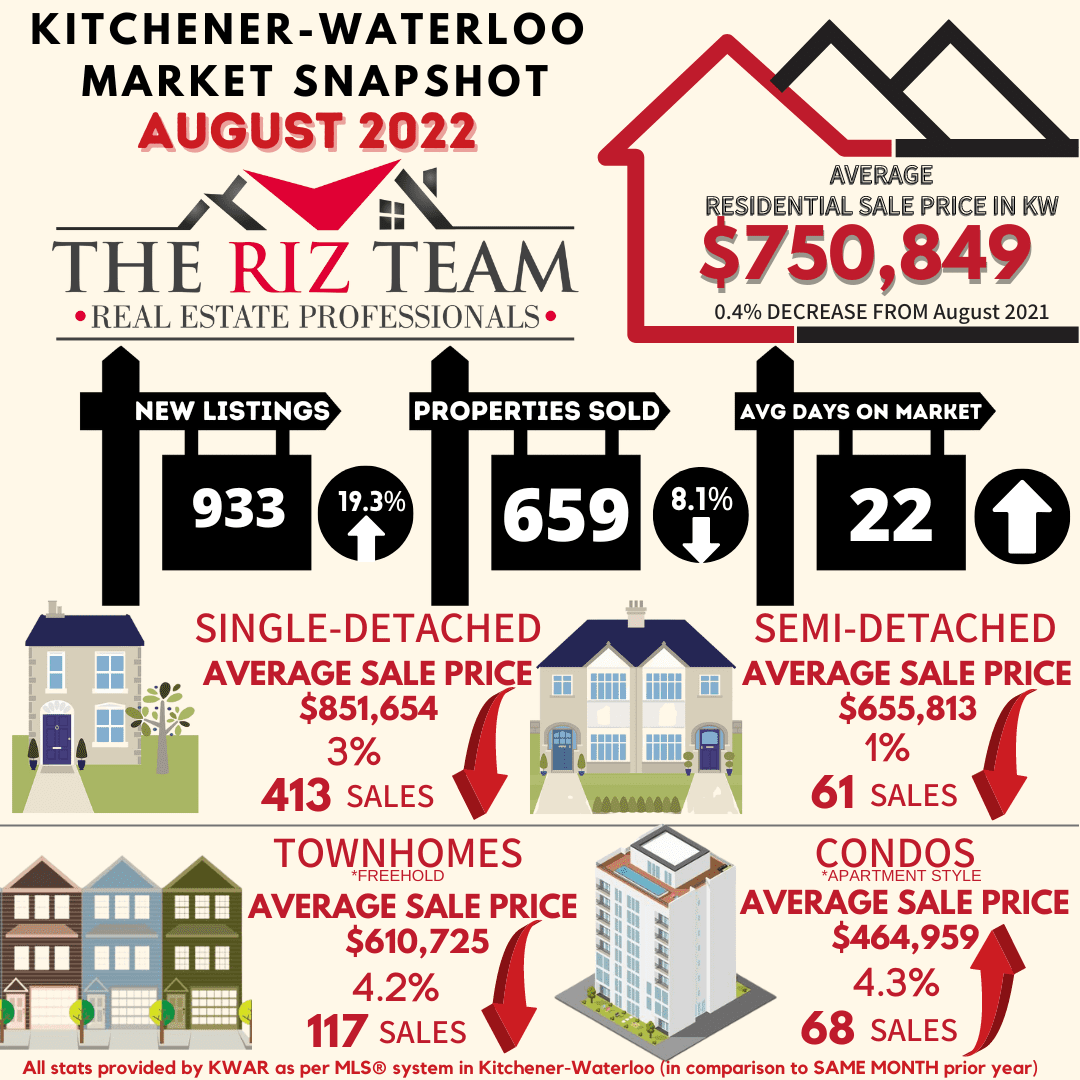
WATERLOO REGION, ON (September 7, 2022) — 659 residential homes were sold last month through the Multiple Listing Service® (MLS®) System of the Waterloo Region Association of REALTORS® (WRAR) in August, a decrease of 8.1 per cent compared to August 2021 and 11.2 per cent below the previous 5-year average for the month.

Total residential sales in August included 413 detached (down 0.7 per cent from August 2021), and 117 townhouses (down 24.0 per cent). Sales also included 68 condominium units (down 26.1 per cent) and 61 semi-detached homes (up 10.9 per cent).

“While the number of homes sold in August was down on a year-over-year basis they were up almost 19 per cent compared to July,” says Megan Bell, president of WRAR. “The decline was most pronounced in the apartment-style condo and townhouse categories which could indicate that rising borrowing costs are having a greater impact on first-time buyers and those looking for more affordable options.”

In August, the average sale price for all residential properties in Waterloo Region was $750,849. This represents a 0.4 per cent decrease compared to August 2021 and a 0.2 per cent decrease compared to July 2022.

  • The average price of a detached home was $851,654. This represents a 3.0 per cent decrease from August 2021 and an increase of 1.1 per cent compared to July 2022.
  • The average sale price for a townhouse was $610,725. This represents a 4.2 per cent decrease from August 2021 and a decrease of 5.2 per cent compared to July 2022.
  • The average sale price for an apartment-style condominium was $464,959. This represents an increase of 4.3 per cent from August 2021 and a decrease of 10.9 per cent compared to July 2022.
  • The average sale price for a semi was $655,813. This represents a decrease of 1.0 per cent compared to August 2021 and a decrease of 0.8 per cent compared to July 2022.

WRAR cautions that average sale price information can be useful in establishing long-term trends but should not be used as an indicator that specific properties have increased or decreased in value. The MLS® Home Price Index (HPI) provides the best way to gauge price trends because averages are strongly distorted by changes in the mix of sales activity from one month to the next.

MLS® Home Price Index Benchmark Price 
  Kitchener-Waterloo  Cambridge 
Benchmark Type:  August 2022  Monthly % Change  Yr./Yr. % Change  August 2022  Monthly % Change  Yr./Yr. % Change 
Composite  $734,500  -1.9  -2.2  $750,700  -3.4  0.6 
Detached  $815,000  -1.5  -3.9  $764,700  -3.1  -1.3 
Townhouse  $618,400  -3.8  5.4  $715,200  -5.9  11.7 
Apartment  $513,600  -2.1  16.1  $578,500  -1.1  19.0 


“Today’s announcement by the Bank of Canada to increase its policy rate by 75 basis points to 3.25 per cent is discouraging news for borrowers as it affects their purchasing power,” says Bell. “However, we see signs that the market is moving towards more buyer-friendly conditions. REALTORS® are reporting fewer multiple offers resulting in final sale prices being closer to the asking price or with more conditions accompanying offers. Even so, with inventory still very tight, Waterloo region remains a seller’s market.”

There were 933 new listings added to the MLS® System in the Waterloo Region last month, an increase of 19.3 per cent compared to August of last year, and a 1.2 per cent increase compared to the previous ten-year average for August.

The total number of homes available for sale in active status at the end of August was 1,003, an increase of 188.2 per cent compared to August of last year, and 31.8 per cent below the previous ten-year average of 1593 listings for August.

The number of months of inventory is up 250 per cent compared to August of last year, but still historically low. There were 1.4 months of inventory in August 2022, down from 1.8 months in July 2022. The number of months of inventory represents how long it would take to sell off current inventories at the current sales rate.

The average number of days to sell in August was 22, compared to 12 days in August 2021. The previous 5-year average is 22 days.

Those requiring specific information on property values should contact a local REALTOR®.  Working with a Realtor is the best way to get a complete picture of the property and community you are considering.

View our HPI tool here to learn more: https://wrar.ca/hpi/

Click on any of the graphs below for an interactive view.

Kitchener Waterloo Market Snapshot July 2022

Friday, August 5th, 2022

“In the wake of July’s interest rate hike, home sales in Waterloo Region continued to slow,” says Megan Bell, President of WRAR. “We’re seeing a clear shift in the market and what people can afford to purchase or are willing to pay. On the bright side for buyers, it’s not the extreme sellers’ market it was.”

If you are considering to Sell your home or Buy a home in the next short while it would be highly beneficial for you to connect with one of our Team Agents at

The Riz Team

Do you want to know what your home is worth today? Click Below for our Online No Obligation Market Evaluation

Click Here

WATERLOO REGION, ON (August 5, 2022) — 550 residential homes were sold through the Multiple Listing Service® (MLS®) System of the Waterloo Region Association of REALTORS® (WRAR) in July, a decrease of 32.8 per cent compared to July 2021, and 32.3 per cent below the previous 5-year average for the month.

Total residential sales in July included 337 detached (down 30.4 per cent from July 2021), and 112 townhouses (down 32.9 per cent). Sales also included 65 condominium units (down 39.3 per cent) and 36 semi-detached homes (down 41.0 per cent).

In July, the average sale price for all residential properties in Waterloo Region was $752,301. This represents a 1.2 per cent decrease compared to July 2021 and a 4.9 per cent decrease compared to June 2022.

  • The average price of a detached home was $842,241. This represents a 6.0 per cent decrease from July 2021 and a decrease of 7.0 per cent compared to June 2022.
  • The average sale price for a townhouse was $642,750. This represents a 3.6 per cent increase from July 2021 and a decrease of 3.3 per cent compared to June 2022.
  • The average sale price for an apartment-style condominium was $521,731. This represents an increase of 20.4 per cent from July 2021 and an increase of 4.1 per cent compared to June 2022.
  • The average sale price for a semi was $661,087. This represents an increase of 1.0 per cent compared to July 2021 and a decrease of 5.4 per cent compared to June 2022.
Price by Property Type July

WRAR cautions that average sale price information can be useful in establishing long-term trends but should not be used as an indicator that specific properties have increased or decreased in value. The MLS® Home Price Index (HPI) provides the best way to gauge price trends because averages are strongly distorted by changes in the mix of sales activity from one month to the next.

MLS® Home Price Index Benchmark Price

  Kitchener-Waterloo Cambridge
Benchmark Type: July 2022 Monthly % Change Yr./Yr. % Change July 2022 Monthly % Change Yr./Yr. % Change
Composite $749,000 -5.3 1.1 $776,900 -3.9 3.4
Detached $827,100 -5.6 -0.8 $789,600 -4.2 1.3
Townhouse $642,500 -5.1 10.5 $760,500 -2.6 17.7
Apartment $524,800 -2.3 17.4 $584,700 -0.0 20.1


MLS® Home Price Index (HPI)

“The real estate market is cooling across the province, and we are seeing significantly fewer buyers from the GTA, which is also impacting prices,” reports Bell. “However, this is not entirely bad news since the previous market was not sustainable. We are all keenly aware of the issues relating to affordability of not just purchasing a home, but rentals as well, and there is clearly more work to be done.”

There were 1,174 new listings added to the MLS® System in the Waterloo Region last month, an increase of 34.0 per cent compared to July of last year, and a 9.2 per cent increase compared to the previous ten-year average for July.

The total number of homes available for sale in active status at the end of July was 1,283, an increase of 215.2 per cent compared to July of last year, and 19.5 per cent below the previous ten-year average of 1593 listings for July.

The number of months of inventory was 1.7 months in July, as it was in June. While this is still at historic lows, the last time it was near this range was September of 2019 when it was 1.6 months.  The number of months of inventory represents how long it would take to sell off current inventories at the current sales rate.

The average number of days to sell in July was 18, compared to 11 days in July 2021. The previous 5-year average is 17 days.

Those requiring specific information on property values should contact a local REALTOR®.  Working with a Realtor is the best way to get a complete picture of the property and community you are considering.

View our HPI tool here to learn more: https://wrar.ca/hpi/

Click on any of the graphs below for an interactive view.

July Average Sales Price WRAR
Average Sales Price - Tonwnship WRAR
Sales - By Property Type WRAR
Months Supply of Homes for Sale July
Monthly Median Sales Price – By Property Type July
Monthly Average Sales Price – By Property Type July
July Days on Market WRAR
KWAR cautions that average sale price information can be useful in establishing long term trends but should not be used as an indicator that specific properties have increased or decreased in value. The average sale price is calculated based on the total dollar volume of all properties sold. Months Supply is the inventory of homes for sale at the end of a given month, divided by the average monthly closed sales from the last 12 months Those requiring specific information on property values should contact a local REALTOR®. REALTORS® have their fingers on the pulse of the market. They know the questions to ask, the areas to probe and what to look for so that you get a complete picture of the property and community you’re considering.

Kitchener Waterloo Market Snapshot June 2022

Wednesday, July 6th, 2022

HOME PRICES CONTINUE TO DIP AS MONTHS SUPPLY RETURNS TO PRE-PANDEMIC LEVEL

If you are considering to Sell your home or Buy a home in the next short while it would be highly beneficial for you to connect with one of our Team Agents at

The Riz Team

Do you want to know what your home is worth today? Click Below for our Online No Obligation Market Evaluation

The Riz Team monthly market stats June 2022. Kitchener Waterloo, ON.


There were 561 residential homes sold through the Multiple Listing Service® System (MLS® System) of the Kitchener-Waterloo Association of REALTORS® (KWAR) in June, a decrease of 24.0 per cent compared to the same month last year, and 17.3 per cent below the previous 5-year average. “For the fourth consecutive month we’re seeing home prices moderate as the number of properties available for sale has steadily increased” says Megan Bell, President of KWAR. “In June the average price of a detached home has levelled off to where it was this time last year.”

Total residential sales in June included 326 detached (down 20.7 per cent from June 2021), and 103 townhouses (down 32.2 per cent). Sales also included 84 condominium units (down 18.4 per cent) and 48 semi-detached homes (down 33.3 per cent).

In June, the average sale price for all residential properties in the Kitchener-Waterloo area was $791,674. This represents a 4.2 per cent increase over June 2021 and a 9.6 per cent decrease compared to May 2022.


  • The average price of a detached home was $920,349. This represents a 0.0 per cent change from June 2021 and a decrease 9.5 per cent compared to May 2022.
  • The average sale price for a townhouse was $662,305. This represents a 11.9 per cent increase from June 2021 and a decrease of 6.5 per cent compared to May 2022.
  • The average sale price for an apartment-style condominium was $497,429. This represents an increase of 11.7 per cent from June 2021 and a decrease of 8.9 per cent compared to May 2022.
  • The average sale price for a semi was $710,284. This represents an increase of 9.5 per cent compared to June 2021 and a decrease of 2.8 per cent compared to May 2022.

KWAR cautions that average sale price information can be useful in establishing long-term trends but should not be used as an indicator that specific properties have increased or decreased in value. The MLS® Home Price Index (HPI) provides the best way to gauge price trends because averages are strongly distorted by changes in the mix of sales activity from one month to the next.

The MLS® HPI composite benchmark price for all residential properties in Kitchener-Waterloo was $790,600 in June. This represents a 6.8 per cent increase over June 2021 and a 6.8 per cent decrease compared to May 2022.

  • The benchmark price for a detached home was $876,600. This represents a 5.3 per cent increase from June 2021 and 7.3 per cent decrease compared to May 2022.
  • The benchmark price for a townhouse is $676,900. This represents a 15.8 per cent increase from June 2021 and a 7.1 per cent decrease compared to May 2022.
  • The benchmark price for an apartment-style condominium was $537,100. This represents a 24.2 per cent increase from June 2021 and a 2.4 per cent decrease compared to May 2022.

“This time last year, sales were going through the roof,” says Bell. “The home buying scene is a little different this year with folks finally taking their postponed trips, attending weddings, and generally catching up on the many missed occasions of the past two years.” Of course, recent hikes in mortgage rates are also contributing to sales cooling, notes KWAR’s president.

“While any shift in the market will result in some individuals predicting the worse, the simple reality is that the market we had been in was unsustainable,” says Bell. “What this means for buyers is more inventory, more choices, and perhaps most importantly, potentially less stress when purchasing. For sellers, they need to ensure their properties stand out from the competition and be aware it may take more time to sell their home and for potentially less money than they were expecting.”

There were 1,285 new listings added to the MLS® System in KW and area last month, an increase of 49.2 per cent compared to June of last year, and a 41.7 per cent increase compared to the previous ten-year average for June.

The total number of homes available for sale in active status at the end of June was 991, an increase of 165.0 per cent compared to June of last year, and 20.6 per cent below the previous ten-year average of 1249 listings for June.

The number of months of inventory increased to 1.8 months in June from 1.6 months in May. While inventory is still at historic lows, this is the highest it’s been since September 2019 and a return to where inventory was in the pre-pandemic June of 2019. The number of months of inventory represents how long it would take to sell off current inventories at the current rate of sales.

The average number of days to sell in June was 13 days, compared to 11 days in June 2021. The previous 5-year average is 17 days.

Those requiring specific information on property values should contact a local REALTOR®.  Working with a Realtor is the best way to get a complete picture of the property and community you are considering.

View our HPI tool here to learn more: https://kwar.ca/hpi-dashboard


Historical Sales By Property Type

Months Supply of Homes for Sale


Historical Median Sales Price – By Property Type


Historical Average Sales Price – By Property Type

Average Days on Market

KWAR cautions that average sale price information can be useful in establishing long term trends but should not be used as an indicator that specific properties have increased or decreased in value. The average sale price is calculated based on the total dollar volume of all properties sold. Months Supply is the inventory of homes for sale at the end of a given month, divided by the average monthly closed sales from the last 12 months Those requiring specific information on property values should contact a local REALTOR®. REALTORS® have their fingers on the pulse of the market. They know the questions to ask, the areas to probe and what to look for so that you get a complete picture of the property and community you’re considering.

Kitchener-Waterloo Market Snapshot March 2022

Monday, April 4th, 2022

KITCHENER-WATERLOO HOME SALES UP IN MARCH, AVERAGE PRICE DIPS FROM FEBRUARY

“The skyrocketing prices of the last two months took a bit of a breather in March, with the overall average price dipping five per cent compared to what we saw in February,” said Megan Bell, President of KWAR. “While it is too soon to draw conclusions from just one month of home sales, I know many will be comforted to see a leveling off on the average price, no matter how incremental.”

If you are considering to Sell your home or Buy a home in the next short while it would be highly beneficial for you to connect with one of our Team Agents at

The Riz Team

Do you want to know what your home is worth today? Click Below for our Online No Obligation Market Evaluation


Total residential sales in March included 416 detached (down 29.7 per cent from March 2021), and 114 condominium units (down 9.5 per cent). Sales also included 64 semi-detached homes (down 17.9 per cent) and 131 townhouses (down 33.8 per cent).

In March, the average sale price for all residential properties in the Kitchener-Waterloo area was $960,181. This represents a 25.5 per cent increase over March 2021 and a 4.6 per cent decrease compared to February 2022.

  • The average price of a detached home was $1,132,637. This represents a 25.9 per cent increase from March 2021 and a decrease 6.4 per cent compared to February 2022.
  • The average sale price for an apartment-style condominium was $565,782. This represents an increase of 33.4 per cent from March 2021 and a decrease of 1.2 per cent compared to February 2022.
  • The average sale price for a townhouse was $796,696. This represents a 27.4 per cent increase from March 2021 and a decrease of 7.6 per cent compared to February 2022.
  • The average sale price for a semi was $876,371. This represents an increase of 34.5 per cent compared to March 2021 and a decrease of 5.0 per cent compared to February 2022.

KWAR cautions that average sale price information can be useful in establishing long-term trends but should not be used as an indicator that specific properties have increased or decreased in value. The MLS®® Home Price Index (HPI) provides the best way to gauge price trends because averages are strongly distorted by changes in the mix of sales activity from one month to the next.

The MLS® HPI composite benchmark price for all residential properties in Kitchener-Waterloo was $960,100 in March. This represents a 29.6 per cent increase over March 2021 and a 1.5 per cent decrease compared to February 2022.

  • The benchmark price for a detached home was $1,046,200. This represents a 28.1 per cent increase from March 2021 and 4.0 per cent decrease compared to February 2022.
  • The benchmark price for an apartment-style condominium was $484,000. This represents a 32.9 per cent increase from March 2021 and a 4.2 per cent increase compared to February 2022.
  • The benchmark price for a townhouse is $765,500. This represents a 41.3 per cent increase from March 2021 and a 4.9 per cent increase compared to February 2022.

“Even though the average price decreased across all property types on a month-to-month basis, the MLS® HPI showed continued monthly gains for both townhouse and apartment property types,” notes Bell.  “As the province feels its way out of the pandemic, we are beginning to see some very preliminary signs of a potential cooling. We are not seeing quite as many multiple offers and some offers are coming in with conditions. Of course, when we say cooling, we’re talking about a market that has been scorching hot which is why we are pleased to see this happening.”

There were 1,131 new listings added to the MLS® System in KW and area last month, a decrease 16.8 per cent compared to the record topping number of listings added in March of last year, and a 28.0 per cent increase compared to the previous ten-year average for March.

The total number of homes available for sale in active status at the end of March was 441, an increase of 1.1 per cent compared to March of last year, and 59.0 per cent below the previous ten-year average of 1,072 listings for March.

The number of months of inventory nudged up to 0.7 months in March from 0.5 months in February. Inventory has been under the one-month mark since October 2020. The number of months of inventory represents how long it would take to sell off current inventories at the current rate of sales.

The average number of days to sell in March was 8 days, the same as it was in March 2021. The previous 5-year average is 16 days.

The More Homes for Everyone Act

Statement from KWAR President Megan Bell

Last week the Government of Ontario introduced a new bill, the More Homes for Everyone Act to address the province’s housing affordability crisis.

While we welcome several aspects of the proposed More Homes for Everyone bill, such as measures to support more timely municipal decision making and developing policies and tools to support multi-generational homes in existing neighbourhoods—bolder actions to increase supply were notably missing.

Ontario’s Housing Affordability Task Force had recommended limiting exclusionary zoning and allowing “as of right” residential housing up to four units and up to four storeys on a single residential lot. Instead, the government has committed to the Task Force’s recommendations as part of a “long term roadmap”.

KWAR is optimistic Waterloo Region will be bold about housing in their official plan update

Ending exclusionary zoning to allow for gentle density in our neighbourhoods is critical to filling the lack of “missing middle” supply for family-sized households.

While Minister Clark states that some municipalities (such as Toronto and Mississauga) were not ready, KWAR is optimistic that the Region of Waterloo (ROW) will take a more progressive view toward increasing density.  On the development side, the Waterloo region has been exceeding density targets set by the province. At KWAR’s recently held Where Do We Grow From Here Symposium we learned from the ROW’s Commissioner, Rod Regier the Region is proposing policies for the ROW official plan that would see a tiered approach to missing middle housing by allowing 4 units and up to 4 storeys, as-of-right, on all land currently zoned residential and on any new greenfield land (residential); and allow a range of 8 to 12 storeys, along specific corridors, such as the ION corridor.

KWAR encourages the Region of Waterloo to stay the course on its bold proposals for its Regional Official Plan and create ways to bring a broad range of housing options to our community.

Those requiring specific information on property values should contact a local REALTOR®.  Working with a Realtor is the best way to get a complete picture of the property and community you are considering.

View our HPI tool here to learn more: https://kwar.ca/hpi-dashboard

Historical Sales By Property Type

Months Supply of Homes for Sale

Historical Median Sales Price – By Property Type

Historical Average Sales Price – By Property Type

Average Days on Market Chart

KWAR cautions that average sale price information can be useful in establishing long term trends but should not be used as an indicator that specific properties have increased or decreased in value. The average sale price is calculated based on the total dollar volume of all properties sold. Months Supply is the inventory of homes for sale at the end of a given month, divided by the average monthly closed sales from the last 12 months Those requiring specific information on property values should contact a local REALTOR®. REALTORS® have their fingers on the pulse of the market. They know the questions to ask, the areas to probe and what to look for so that you get a complete picture of the property and community you’re considering.

Kitchener-Waterloo Market Snapshot August 2021

Friday, September 3rd, 2021

August Stats 2021

HOMEBUYING DEMAND CONTINUES TO OVERWHELM HOUSING SUPPLY

KITCHENER-WATERLOO, ON (September 3, 2021) –– A total of 535 residential homes sold last month through the Multiple Listing Service® (MLS® System) of the Kitchener-Waterloo Association of REALTORS® (KWAR), a decrease of 22.1 per cent compared to last August’s record-smashing month, and a decrease of 12.3 per cent compared to July.

While sales were down relative to last month and last August, they remained well above average notes KWAR’s president, Nicole Pohl. “The main reason for the decrease is simply that last month was the first full month in Step 3 of the reopening, and people were tired of the lockdown,” says Pohl. “They got out and enjoyed their summer and shifted their real estate needs to the back burner for a much-needed change of focus.”

Total residential sales in August included 299 detached (down 30.6 per cent from August 2020), and 80 condominium units (down 1.2 per cent). Sales also included 38 semi-detached homes (down 2.6) and 118 townhouses (down 13.2 per cent).

In August, the average sale price for all residential properties in the Kitchener-Waterloo area was $753,296. This represents a 19.3 per cent increase over August 2020 and a 0.3 per cent decrease compared to July 2021

  • The average price of a detached home was $895,756. This represents a 22.5 per cent increase from August 2020 and a decrease of 1.3 per cent compared to July 2021.
  • The average sale price for an apartment-style condominium was $445,280. This represents an increase of 18.2 per cent from August 2020 and an increase of 3.7 per cent compared to July 2021.
  • The average sale price for a townhouse was $623,767. This represents a 26.1 per cent increase from August 2020 and an increase of 0.1 per cent compared to July 2021.
  • The average sale price for a semi was $683,048. This represents an increase of 26.5 per cent compared to August 2020 and an increase of 2.3 per cent compared to July 2021.


KWAR cautions that average sale price information can be useful in establishing long-term trends but should not be used as an indicator that specific properties have increased or decreased in value. The MLS® Home Price Index (HPI) provides the best way to gauge price trends because averages are strongly distorted by changes in the mix of sales activity from one month to the next.

The MLS® HPI composite benchmark price for all residential properties in Kitchener-Waterloo was $757,900 in August. This represents a 29.5 per cent increase over August 2020 and a 1.2 per cent increase compared to July 2021.

  • The benchmark price for a detached home was $837,100. This represents a 31.5 per cent increase from August 2020 and 1.8 per cent increase compared to July 2021.
  • The benchmark price for an apartment-style condominium was $380,700. This represents a 11.7 per cent increase from August 2020 and a 1.3 per cent decrease compared to July 2021.
  • The benchmark price for a townhouse is $568,000. This represents a 37.3 per cent increase from August 2020 and a 0.6 per cent increase compared to July 2021.


There were 590 new listings added to the MLS® System in KW and area last month, a decrease of 27.6 per cent compared to August of last year, and a 13 per cent decrease compared to the previous ten-year average for August.

The total number of homes available for sale in active status at the end of August was 255, a decrease of 53.6 per cent compared to August of last year, and 79.5 per cent below the previous ten-year average of 1,252 listings for August.

“The number of homes coming to market continues to be overwhelmed by the number of homebuyers we have wanting to purchase in Waterloo Region,” says Pohl.

The number of months of inventory persisted from the July level of 0.4 months in August. Inventory has numbered less than 1 month since October. The number of months of inventory represents how long it would take to sell off current inventories at the current rate of sales.

The average number of days to sell in August was 12 days, compared to 17 days in August 2020 and a previous 5-year average of 26 days.

Those requiring specific information on property values should contact a local REALTOR®.  Working with a Realtor is the best way to get a complete picture of the property and community you are considering.

View our HPI tool here to learn more: https://kwar.ca/hpi-dashboard

Historical Sales By Property Type

Months Supply of Homes for Sale


Historical Median Sales Price – By Property Type


Historical Average Sales Price – By Property Type


Average Days on Market 


© Copyright 2017, Real Estate Websites by Redman Technologies Inc. | Privacy Policy | Disclaimer | Sitemap

MLS®, REALTOR®, and the associated logos are trademarks of The Canadian Real Estate Association.

The data included on this website is deemed to be reliable, but is not guaranteed to be accurate by the Kitchener-Waterloo Real Estate Board. The trademarks REALTOR®, REALTORS® and the REALTOR® logo are controlled by The Canadian Real Estate Association (CREA) and identify real estate professionals who are members of CREA. Used under license.