Kitchener-Waterloo Market Snapshot October 2021
Wednesday, November 3rd, 2021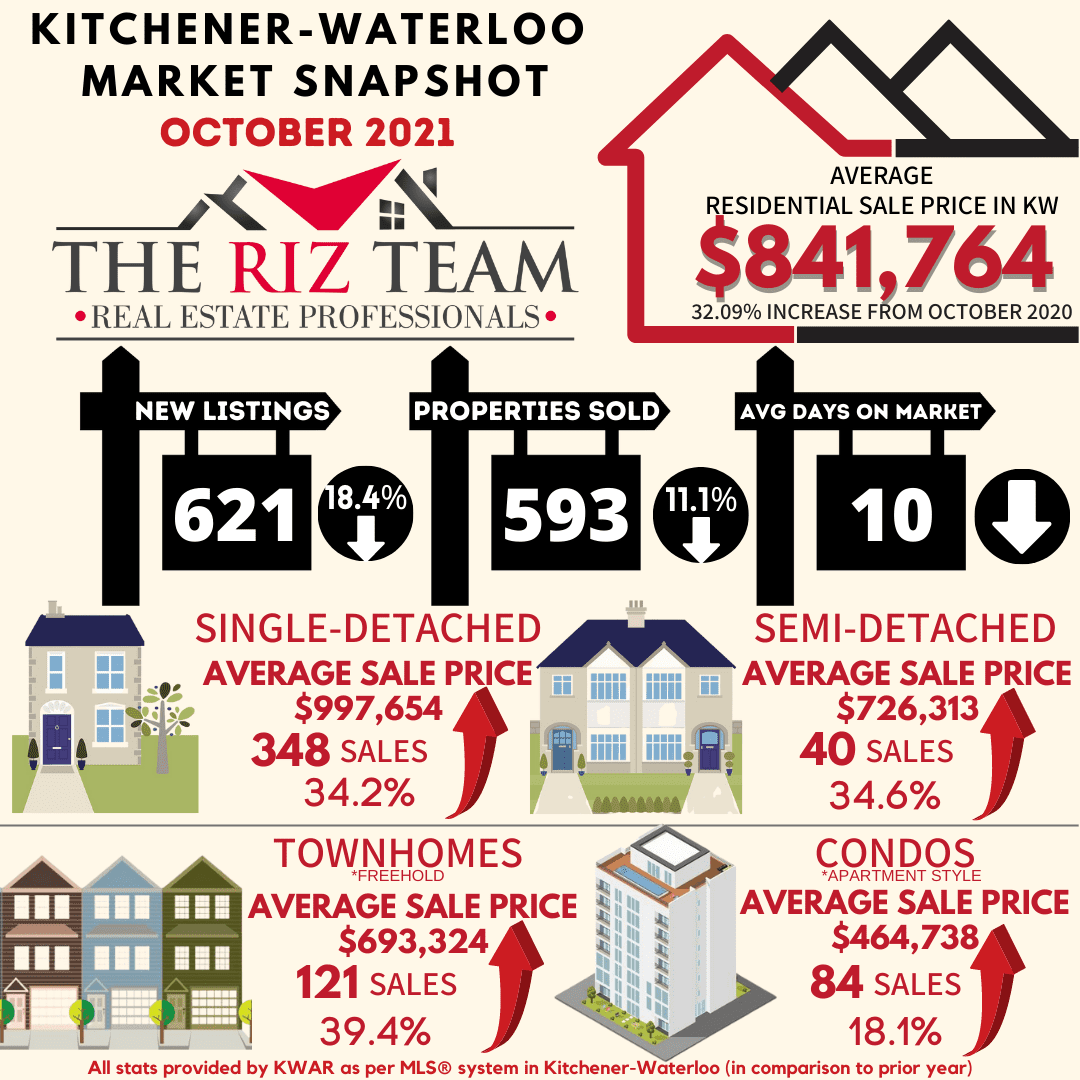
PRICES CONTINUE TO INCREASE WITH STRONG HOME SALES IN OCTOBER
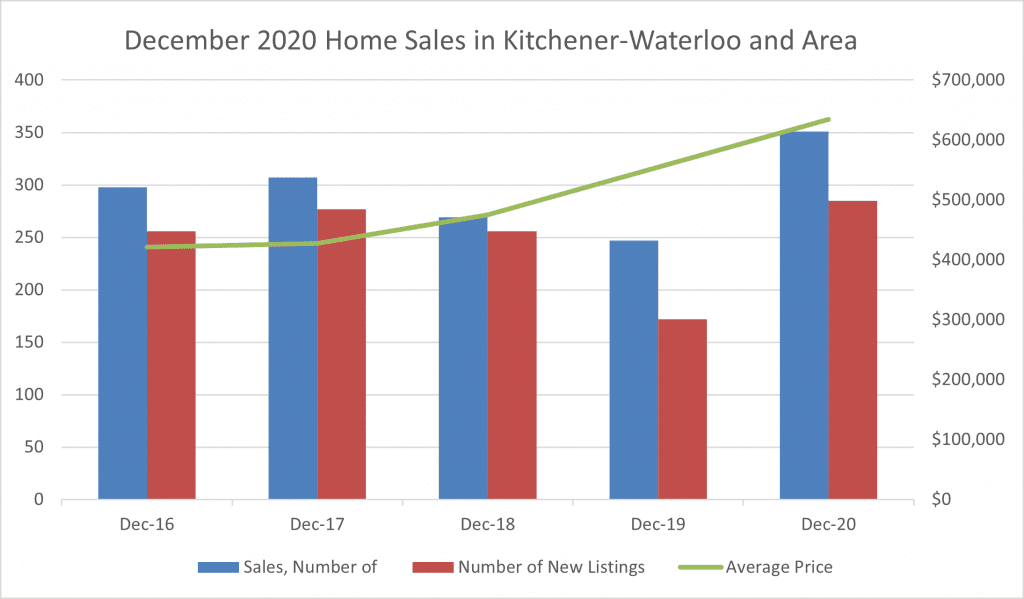
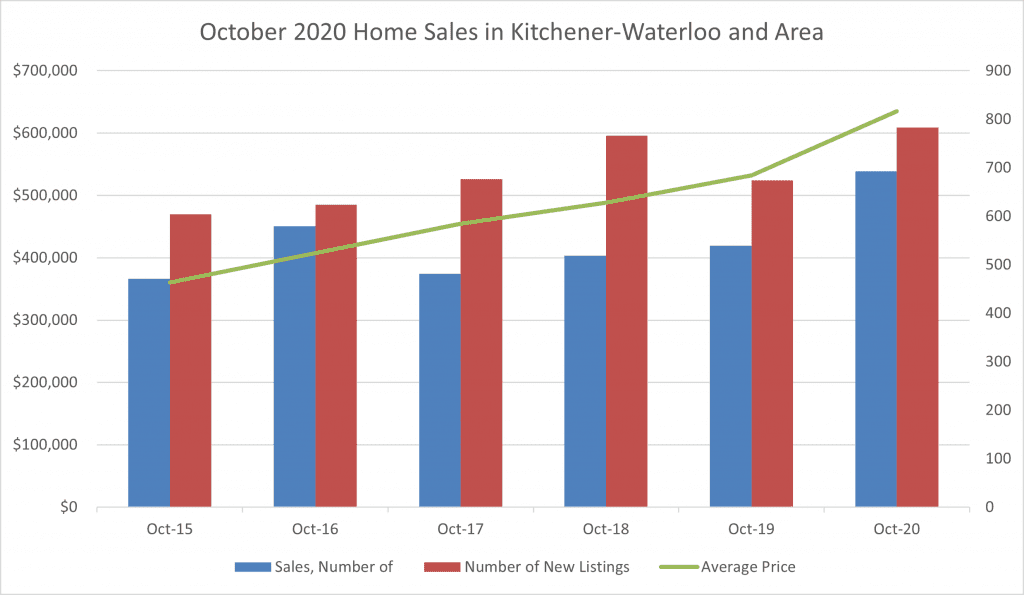
KITCHENER-WATERLOO, ON (November 3, 2021) –– A total of 593 residential homes sold last month through the Multiple Listing Service® (MLS® System) of the Kitchener-Waterloo Association of REALTORS® (KWAR), a decrease of 11.1 per cent compared to last October and a decrease of 16.5 per cent compared to September.
“While not as red-hot as last year’s record-breaking October, it was still a higher-than-normal number of home sales for the month, and the second-highest October on record,” says KWAR’s president, Nicole Pohl. “The number of listings coming on the market can scarcely keep up with the demand for homes in Waterloo region, and the continued price growth we see in October reflects this.”
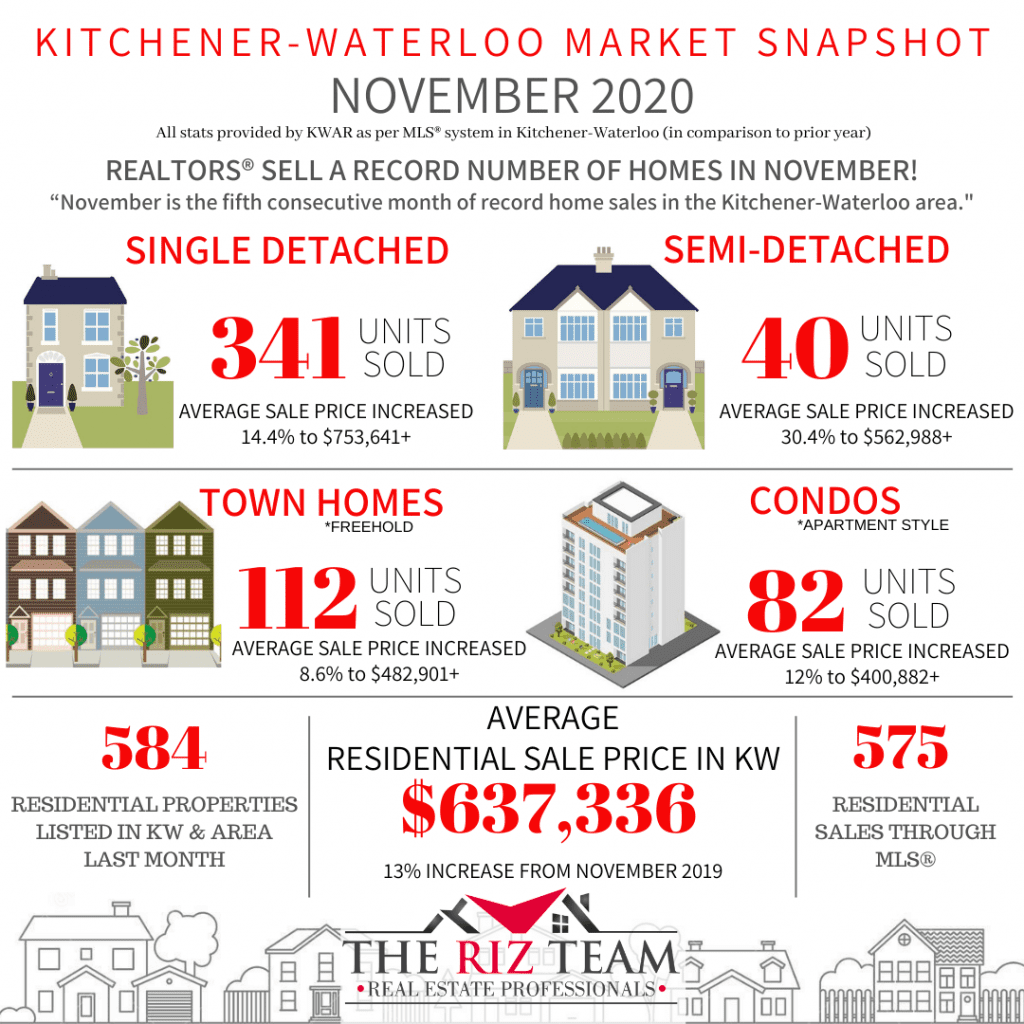
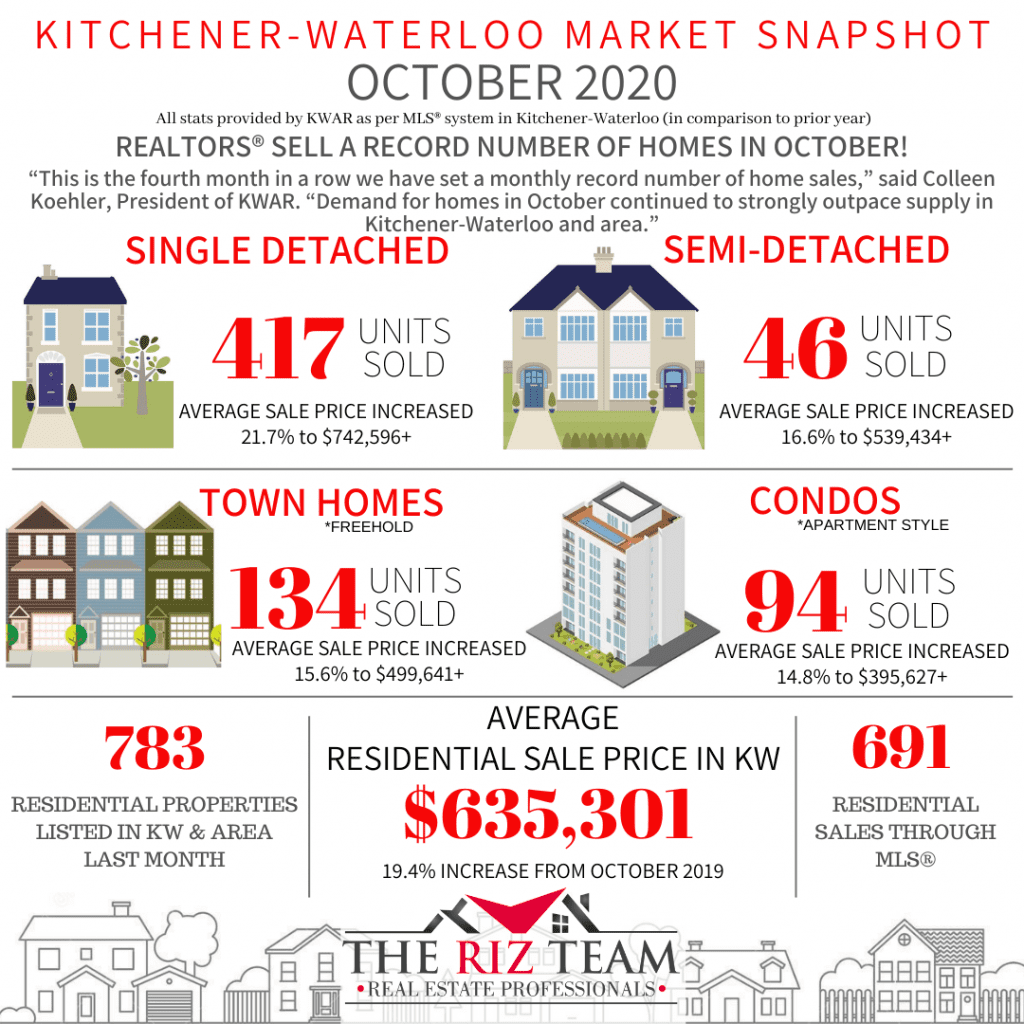
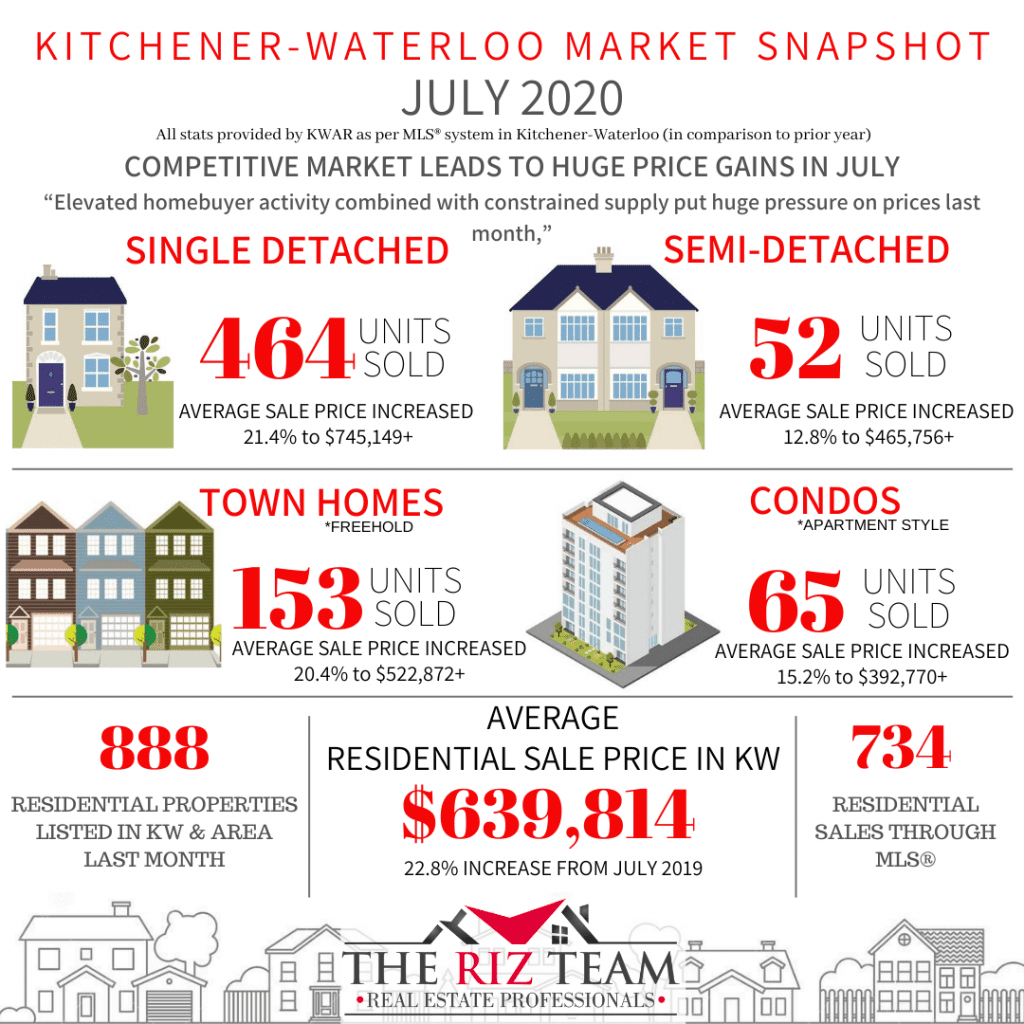
Total residential sales in October included 348 detached (down 13.2 per cent from October 2020), and 84 condominium units (down 8.7 per cent). Sales also included 40 semi-detached homes (down 9.1) and 121 townhouses (down 6.9 per cent).
In October, the average sale price for all residential properties in the Kitchener-Waterloo area was $841,764. This represents a 32.9 per cent increase over October 2020 and a 6.1 per cent increase compared to September 2021.
- The average price of a detached home was $997,654. This represents a 34.2 per cent increase from October 2020 and an increase of 3.5 per cent compared to September 2021.
- The average sale price for an apartment-style condominium was $464,738. This represents an increase of 18.1 per cent from October 2020 and a decrease of 7.1 per cent compared to September 2021.
- The average sale price for a townhouse was $693,324. This represents a 39.4 per cent increase from October 2020 and an increase of 7.3 per cent compared to September 2021.
- The average sale price for a semi was $726,313. This represents an increase of 34.6 per cent compared to October 2020 and an increase of 5.6 per cent compared to September 2021.

KWAR cautions that average sale price information can be useful in establishing long-term trends but should not be used as an indicator that specific properties have increased or decreased in value. The MLS® Home Price Index (HPI) provides the best way to gauge price trends because averages are strongly distorted by changes in the mix of sales activity from one month to the next.
The MLS® HPI composite benchmark price for all residential properties in Kitchener-Waterloo was $803,900 in October. This represents a 34.3 per cent increase over October 2020 and a 2.5 per cent increase compared to September 2021.
- The benchmark price for a detached home was $887,500. This represents a 35.5 per cent increase from October 2020 and 2.1 per cent increase compared to September 2021.
- The benchmark price for an apartment-style condominium was $406,400. This represents a 22.7 per cent increase from October 2020 and a 3.5 per cent increase compared to September 2021.
- The benchmark price for a townhouse is $603,900. This represents a 42.5 per cent increase from October 2020 and a 3.8 per cent increase compared to September 2021.

“With ongoing constraints on supply versus demand, home prices continued to accelerate in October,” says Pohl.
There were 621 new listings added to the MLS® System in KW and area last month, a decrease of 18.4 per cent compared to October of last year, and a 12.1 per cent decrease compared to the previous ten-year average for October.
The total number of homes available for sale in active status at the end of October was 288, a decrease of 36 per cent compared to October of last year, and 76.5 per cent below the previous ten-year average of 1,285 listings for October.
The number of months of inventory remained at 0.5 in October. Inventory has settled at under 1 month for twelve consecutive months. The number of months of inventory represents how long it would take to sell off current inventories at the current rate of sales.
The average number of days to sell in October was 10 days, compared to 13 days in October 2020 and a previous 5-year average of 22 days.
“Affordability throughout Waterloo Region continues to be challenged, creating significant barriers especially for many people who are just trying to get their foot in the door of the housing market,” says Pohl. “We are urging all levels of government to work together to tackle the supply issue facing housing markets across the country and right here in Waterloo region.”
Over the past two weeks representatives of KWAR, alongside REALTORS® from across Canada have been meeting with Members of Parliament to talk about Canada’s economic recovery plan and the need to prioritize housing. You can read about the ideas that REALTORS® are proposing here: https://www.crea.ca/mp
Those requiring specific information on property values should contact a local REALTOR®. Working with a Realtor is the best way to get a complete picture of the property and community you are considering.
View our HPI tool here to learn more: https://kwar.ca/hpi-dashboard
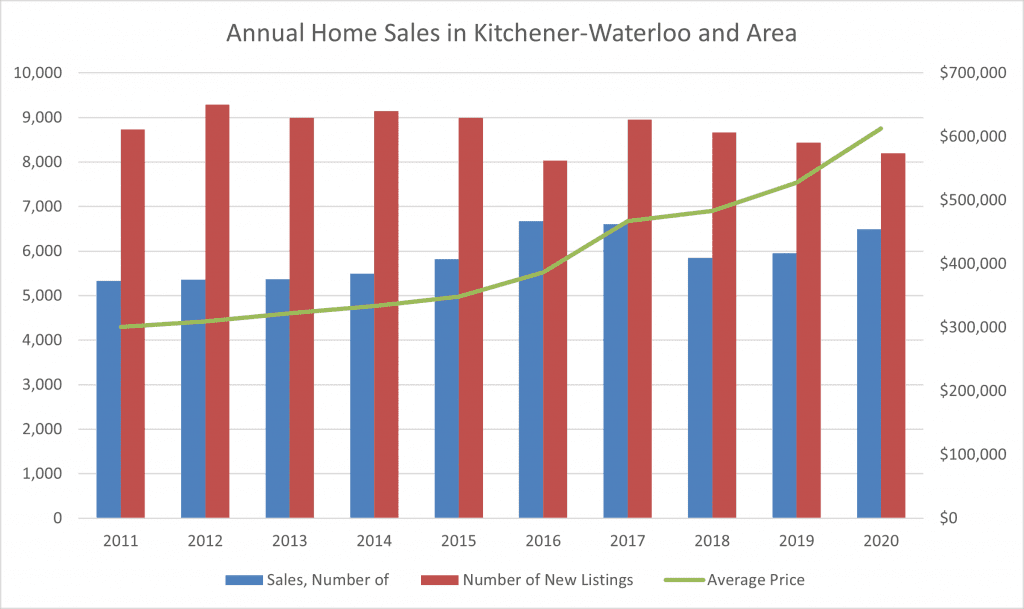
Historical Sales By Property Type

Months Supply of Homes for Sale

Historical Median Sales Price – By Property Type

Historical Average Sales Price – By Property Type


KWAR cautions that average sale price information can be useful in establishing long term trends but should not be used as an indicator that specific properties have increased or decreased in value. The average sale price is calculated based on the total dollar volume of all properties sold. Months Supply is the inventory of homes for sale at the end of a given month, divided by the average monthly closed sales from the last 12 months Those requiring specific information on property values should contact a local REALTOR®. REALTORS® have their fingers on the pulse of the market. They know the questions to ask, the areas to probe and what to look for so that you get a complete picture of the property and community you’re considering.