The Riz Team Blog

Archive for the ‘Waterloo Buyers’ Category

Kitchener-Waterloo Market Snapshot June 2021

Tuesday, July 6th, 2021
Number of Home Sales Set New June Record

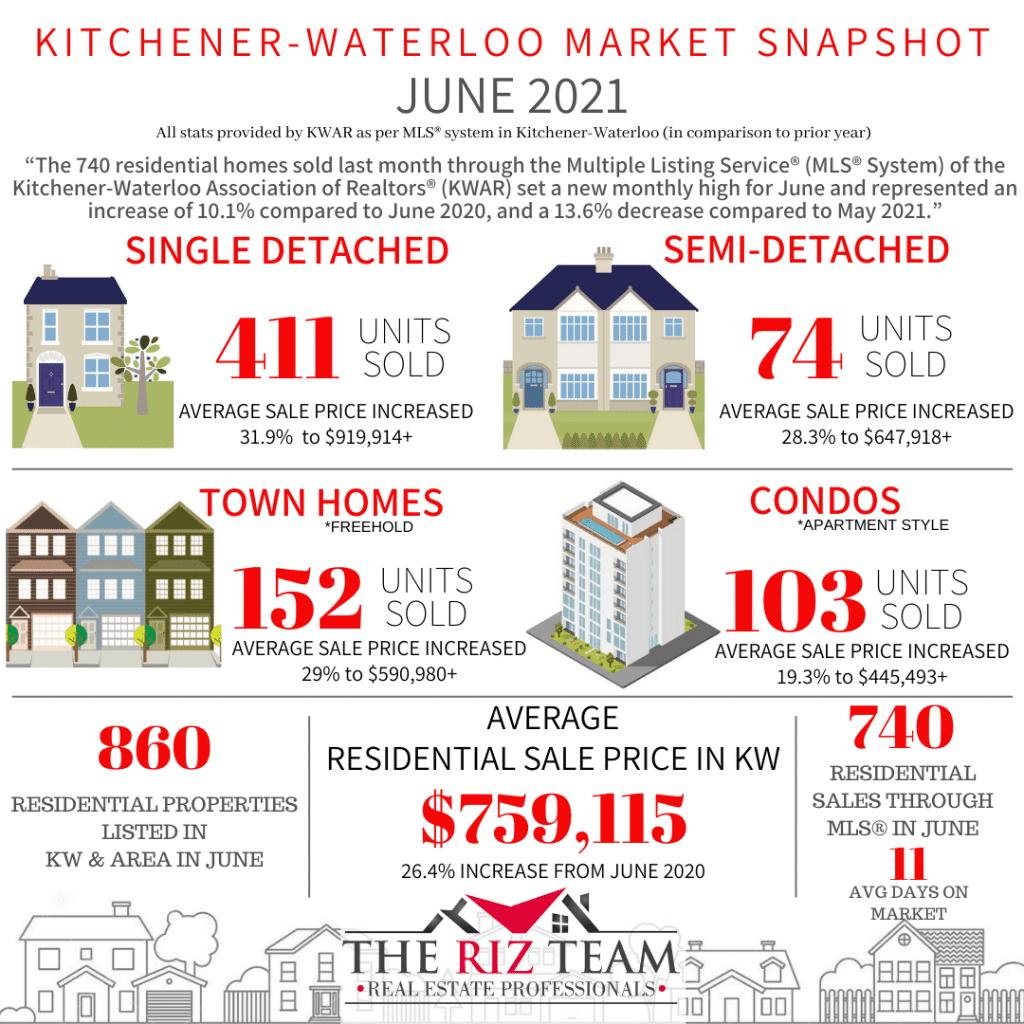
KITCHENER-WATERLOO, ON (July 6, 2021) –– The 740 residential homes sold last month through the Multiple Listing Service® (MLS® System) of the Kitchener-Waterloo Association of REALTORS® (KWAR) set a new monthly high for June and represented an increase of 10.1 per cent compared to June 2020, and a 13.6 per cent decrease compared to May 2021.

“The number of homes sold in the Kitchener-Waterloo area these past 6 months surpasses any previous 6 months of activity through our MLS® System,” says Nicole Pohl, President of KWAR. “Since the beginning of the year, we have reported 4,393 home sales in Kitchener-Waterloo and area, which is remarkable.”

Total residential sales during this second quarter (April, May, June) are up 83.7 per cent compared to last year. On a year-to-date basis, they are up 65.7 per cent.

Total residential sales in June included 411 detached (down 0.2 per cent from June 2020), and 103 condominium units (up 51.5 per cent). Sales also included 74 semi-detached homes (on par) and 152 townhouses (up 14.3 per cent).

In June, the average sale price for all residential properties in the Kitchener-Waterloo area was $759,115. This represents a 26.4 per cent increase over June 2020 and a 2.6 per cent increase compared to May 2021.

      • The average price of a detached home was $919,914. This represents a 31.9 per cent increase from June 2020 and an increase of 5.9 per cent compared to May 2021.
      • The average sale price for an apartment-style condominium was $445,493. This represents an increase of 19.3 per cent from June 2020 and a decrease of 2.3 per cent compared to May 2021.
      • The average sale price for a townhouse was $590,980. This represents a 29 per cent increase from June 2020 and a decrease of 1.9 per cent compared to May 2021.
      • The average sale price for a semi was $647,918. This represents an increase of 28.3 per cent compared to June 2020 and a decrease of 1.8 per cent compared to May 2021.

KWAR cautions that average sale price information can be useful in establishing long-term trends but should not be used as an indicator that specific properties have increased or decreased in value. The MLS® Home Price Index (HPI) provides the best way to gauge price trends because averages are strongly distorted by changes in the mix of sales activity from one month to the next.

The MLS® HPI composite benchmark price for all residential properties in Kitchener-Waterloo was $745,800 in June. This represents a 32.1 per cent increase over June 2020 and a 0.4 per cent decrease compared to May 2021.

The benchmark price for a detached home was $820,800. This represents a 32.7 per cent increase from June 2020 and 0.6 per cent increase compared to May 2021.

      • The benchmark price for an apartment-style condominium was $373,400. This represents a 17 per cent increase from June 2020 and a 0.1 per cent decrease compared to May 2021.
      • The benchmark price for a townhouse is $566,900. This represents a 45 per cent increase from June 2020 and a 1.4 per cent decrease compared to May 2021.

“The greatest challenge of the housing market continues to be the limited supply of existing homes to purchase,” says Pohl. “What we could use right now is for more homes to get built to help meet the robust buyer demand which continues to exceed supply.”

There were 860 new listings added to the MLS® System in KW and area last month, a decrease of 6.6 per cent compared to June of last year, and a 5.4 per cent decrease compared to the previous ten-year average for June.

The total number of homes available for sale in active status at the end of June was 365, a decrease of 43 per cent compared to June of last year, and 73.9 per cent below the previous ten-year average of 1,400 listings for June.

The number of months of inventory was 0.5 in June, a decline from 0.7 months in May. Inventory has numbered less than 1 month since October. The number of months of inventory represents how long it would take to sell off current inventories at the current rate of sales.

The average number of days to sell in June was 11 days, compared to 17 days in June 2020 and a previous 5-year average of 20 days.

Those requiring specific information on property values should contact a local REALTOR®.  Working with a Realtor is the best way to get a complete picture of the property and community you are considering.

View our HPI tool here to learn more: https://kwar.ca/hpi-dashboard

Historical Sales By Property Type

Months Supply of Homes for Sale

Historical Median Sales Price – By Property Type

Historical Average Sales Price – By Property Type

Average Days on Market Chart

Kitchener-Waterloo Market Snapshot April 2021

Wednesday, May 5th, 2021

KW Market Stats April 2021

NUMBER OF HOME SALES IN APRIL SECOND HIGHEST ON RECORD

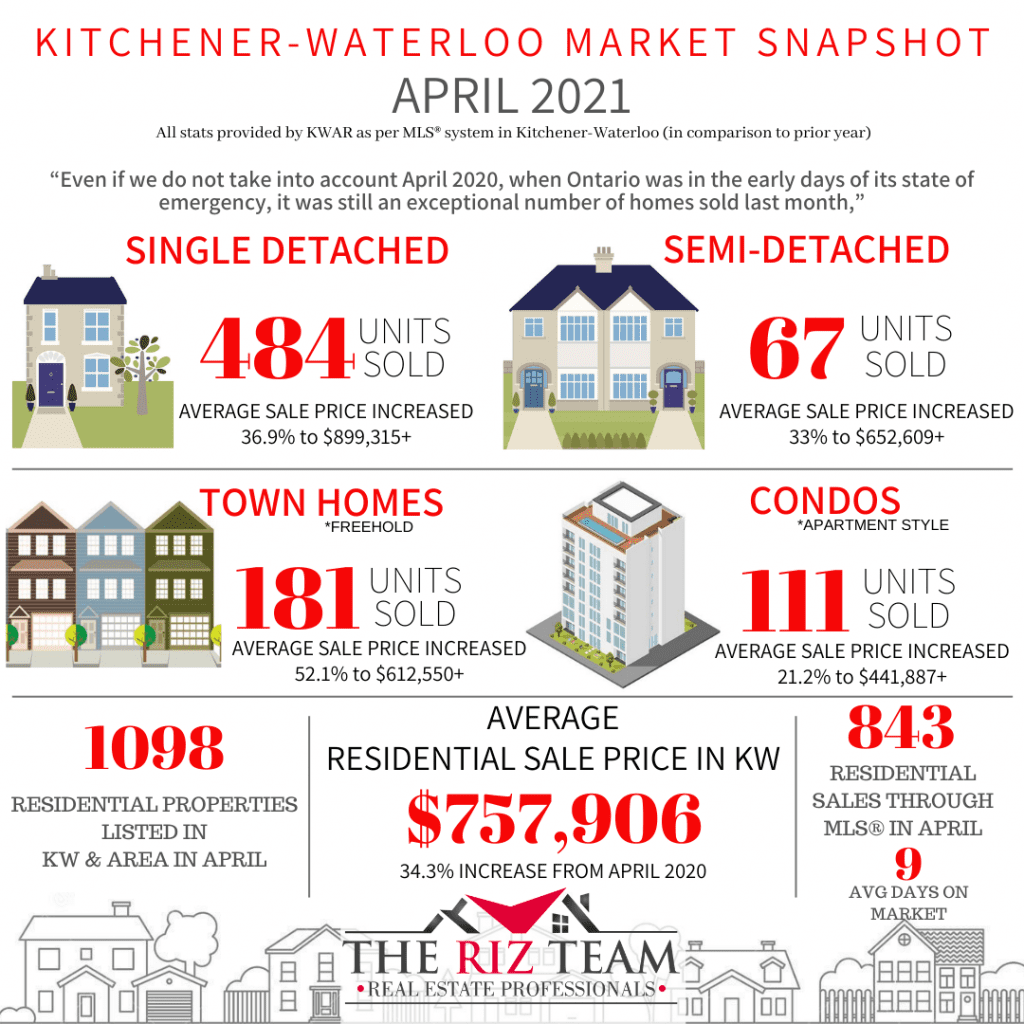
KITCHENER-WATERLOO, ON (May 5, 2021) –– Following last month’s record-smashing number of home sales, the Kitchener-Waterloo Association of REALTORS® (KWAR) posted the second-highest number of monthly home sales in April. There were 843 residential homes sold through the Multiple Listing Service® (MLS® System) of KWAR last month, an increase of 263.4 per cent compared to April 2020, and a decrease of 15.5 per cent compared to March 2021.

“Even if we do not take into account April 2020, when Ontario was in the early days of its state of emergency, it was still an exceptional number of homes sold last month,” says Nicole Pohl, President of KWAR. “The previous 10-year average number of residential sales for April was 618.”

Total residential sales in April included 484 detached (up 233.8 per cent from April 2020), and 111 condominium units (up 382.6 per cent). Sales also included 67 semi-detached homes (up 294.1 per cent) and 181 townhouses (up 285.1 per cent).

In April, the average sale price for all residential properties in the Kitchener-Waterloo area was $757,906. This represents a 34.3 per cent increase over April 2020 and a 0.9 per cent decrease compared to March 2021.

      • The average price of a detached home was $899,315. This represents a 36.9 per cent increase from April 2020 and an increase of 0.04 per cent compared to March 2021.
      • The average sale price for an apartment-style condominium was $441,887. This represents an increase of 21.2 per cent from April 2020 and an increase of 4.2 per cent compared to March 2021.
      • The average sale price for a townhouse was $612,550. This represents a 52.1 per cent increase from April 2020 and a decrease of 2.03 per cent compared to March 2021.
      • The average sale price for a semi was $652,609. This represents an increase of 33.0 per cent compared to April 2020 and an increase of 0.18 per cent compared to March 2021.

“We are starting to see home prices calm down in March and April compared to what was happening in January and February,” says Pohl.

KWAR cautions that average sale price information can be useful in establishing long-term trends but should not be used as an indicator that specific properties have increased or decreased in value. The MLS® Home Price Index (HPI) provides the best way to gauge price trends because averages are strongly distorted by changes in the mix of sales activity from one month to the next.

The MLS® HPI composite benchmark price for all residential properties in Kitchener-Waterloo was $742,800 in April. This represents a 40.4 per cent increase over April 2020 and a 0.6 per cent increase compared to March 2021.

      • The benchmark price for a detached home was $809,000. This represents a 39.9 per cent increase from April 2020 and 1.0 per cent decrease compared to March 2021.
      • The benchmark price for an apartment-style condominium was $374,100. This represents a 31.1 per cent increase from April 2020 and a 4.3 per cent increase compared to March 2021.
      • The benchmark price for a townhouse is $591,300. This represents a 47.2 per cent increase from April 2020 and a 6.6 per cent increase compared to March 2021.

There were 1,098 new listings added to the MLS® System in KW and area last month, an increase of 162.7 per cent compared to April of last year, and a 17.15 per cent increase compared to the previous ten-year average for April* (*calculated from 2019 to 2010 to adjust for the impact of the state of emergency on activity in April 2020).

The total number of homes available for sale in active status at the end of April was 458, a decrease of 21.8 per cent compared to April of last year, and 66.9 per cent below the previous ten-year average of 1,384 listings for April* (*calculated from 2010 to 2019 to adjust for the impact of the state of emergency on activity in April 2020).

The number of months of inventory was 0.7 in April, which is unchanged from March. Inventory has numbered less than 1 month since October. The number of months of inventory represents how long it would take to sell off current inventories at the current rate of sales.

The average number of days to sell in April was 9 days, compared to 19 days in April 2020 and a previous 5-year average of 21 days.

Those requiring specific information on property values should contact a local REALTOR®.  Working with a Realtor is the best way to get a complete picture of the property and community you are considering.

View our HPI tool here to learn more: https://kwar.ca/hpi-dashboard

Historical Sales By Property Type

Months Supply of Homes for Sale

Historical Median Sales Price – By Property Type

Historical Average Sales Price – By Property Type

Average Days on Market Chart

Kitchener Market Snapshot March 2021

Tuesday, April 6th, 2021

RECORD SMASHING NUMBER OF HOME SALES IN MARCH

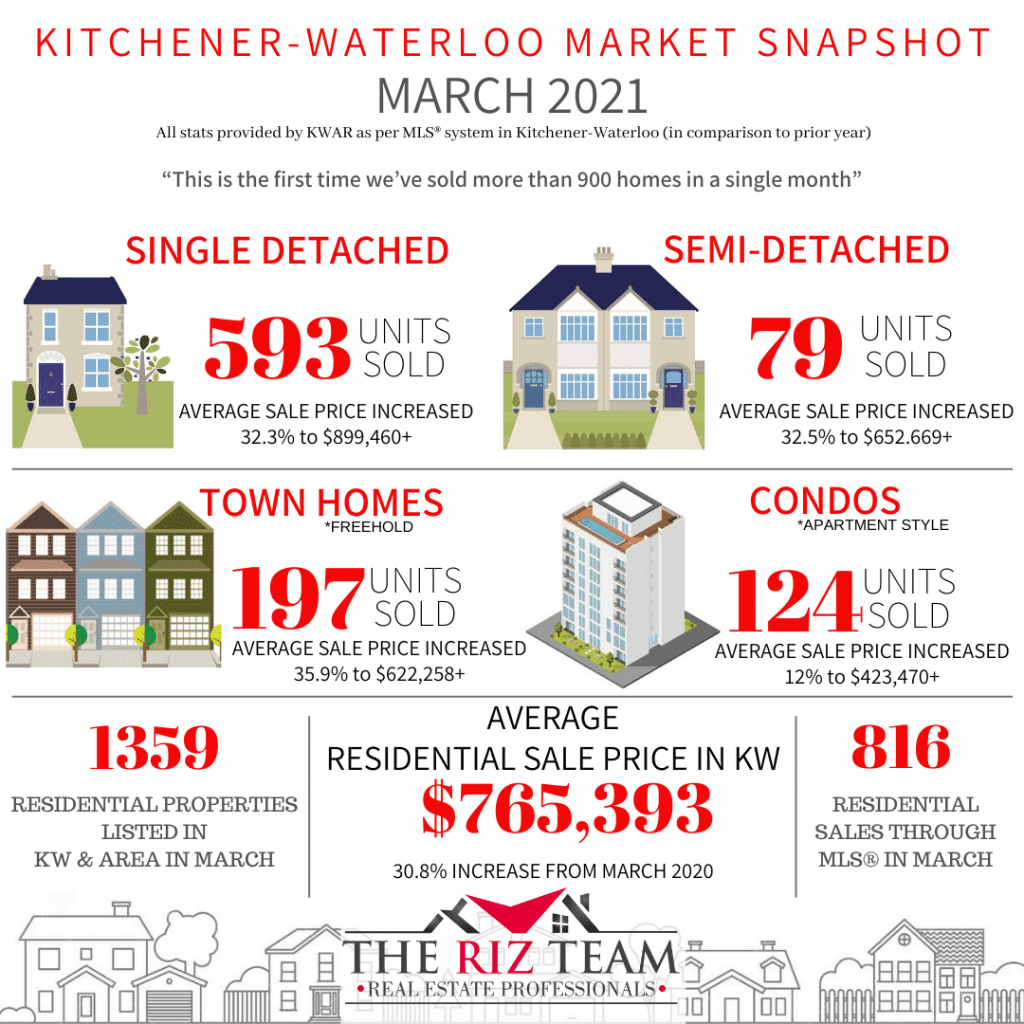
KITCHENER-WATERLOO, ON (April 6, 2021) –– In March, the Kitchener-Waterloo Association of REALTORS® (KWAR) posted the highest number of monthly home sales in the board’s history. There were 993 residential homes sold through the Multiple Listing Service® (MLS® System) of KWAR in March, an increase of 72.7 per cent compared to March 2020, and an increase of 66 per cent compared to the previous month. The previous 10-year average number of residential sales for March is 552.

“This is the first time we’ve sold more than 900 homes in a single month,” says Nicole Pohl, President of KWAR. “The second highest number of sales occurred in May 2017 when there were 816 sales through our MLS® System.”

Total residential sales in March included 593 detached (up 69.4 per cent from March 2020), and 124 condominium units (up 82.4 per cent). Sales also included 79 semi-detached homes (up 216 per cent) and 197 townhouses (up 49.2 per cent).

In March, the average sale price for all residential properties in the Kitchener-Waterloo area was $765,393. This represents a 30.8 per cent increase over March 2020, and a 1.5 per cent increase compared to February 2021.

      • The average price of a detached home was $899,460. This represents a 32.3 per cent increase from March 2020, and a decrease of 1.4 per cent compared to February 2021.
      • The average sale price for an apartment-style condominium was $423,470. This represents an increase of 12 per cent from March 2020, and an increase of 1.6 per cent compared to February 2021.
      • The average sale price for a townhouse was $622,258. This represents a 35.9 per cent increase from March 2020, and an increase of 2 per cent compared to February 2021.
      • The average sale price for a semi was $652,669. This represents an increase of 32.5 per cent compared to March 2020, and a decrease of 4.8 per cent compared to February 2021.

“On a year-over-year basis we continued to see huge price increases in the average price in March, however compared to February we are seeing some signs that perhaps prices may be starting to stabilize a bit,” says Pohl.

KWAR cautions that average sale price information can be useful in establishing long term trends but should not be used as an indicator that specific properties have increased or decreased in value. The MLS® Home Price Index (HPI) provides the best way to gauge price trends because averages are strongly distorted by changes in the mix of sales activity from one month to the next.

The MLS® HPI composite benchmark price for all residential properties in Kitchener-Waterloo was $738,200 in March. This represents a 33.4 per cent increase over March 2020 and a 4 per cent increase compared to February 2021.

      • The benchmark price for a detached home was $817,000. This represents a 34.4 per cent increase from March 2020 and 3.6 per cent increase compared to February 2021.
      • The benchmark price for an apartment-style condominium was $358,700. This represents a 14.9 per cent increase from March 2020 and a 5.1 per cent increase compared to February 2021.
      • The benchmark price for a townhouse is $554,900. This represents a 38.3 per cent increase from March 2020 and a 5.4 per cent increase compared to February 2021.

“In addition to the record number of sales in March, we also had a record number of newly listed properties come on the market,” says Pohl. “The number of new listings last month was the most of any month, and the highest number since May of 2017 when there were 1,271 new listings.”

There were 1,359 new listings added to the MLS® System in KW and area last month, an increase of 56.2 per cent compared to March of last year, and a 63.9 per cent increase compared to the previous ten-year average for March.

Pohl notes while the additional inventory is welcome, home buying demand continues to substantially outpace supply.

The total number of homes available for sale in active status at the end of March was 434, a decrease of 23.5 per cent compared to March of last year, and 63.5 per cent below the previous ten-year average of 1,188 listings for March.

The number of months of inventory was 0.7 in March and has numbered less than 1 month since October. The number of months of inventory represents how long it would take to sell off current inventories at the current rate of sales.

The average number of days to sell in March was 8 days, compared to 16 days in March 2020 and a previous 5-year average of 21 days.

Those requiring specific information on property values should contact a local REALTOR®.  Working with a Realtor is the best way to get a complete picture of the property and community you are considering.

View our HPI tool here to learn more: https://kwar.ca/hpi-dashboard

Historical Sales By Property Type


Months Supply of Homes for Sale


Historical Median Sales Price – By Property Type


Historical Average Sales Price – By Property Type


Average Days on Market Chart

KWAR cautions that average sale price information can be useful in establishing long term trends but should not be used as an indicator that specific properties have increased or decreased in value. The average sale price is calculated based on the total dollar volume of all properties sold. Months Supply is the inventory of homes for sale at the end of a given month, divided by the average monthly closed sales from the last 12 months Those requiring specific information on property values should contact a local REALTOR®. REALTORS® have their fingers on the pulse of the market. They know the questions to ask, the areas to probe and what to look for so that you get a complete picture of the property and community you’re considering.

Kitchener Market Snapshot February 2021

Thursday, March 4th, 2021

RECORD NUMBER OF HOME SALES IN FEBRUARY


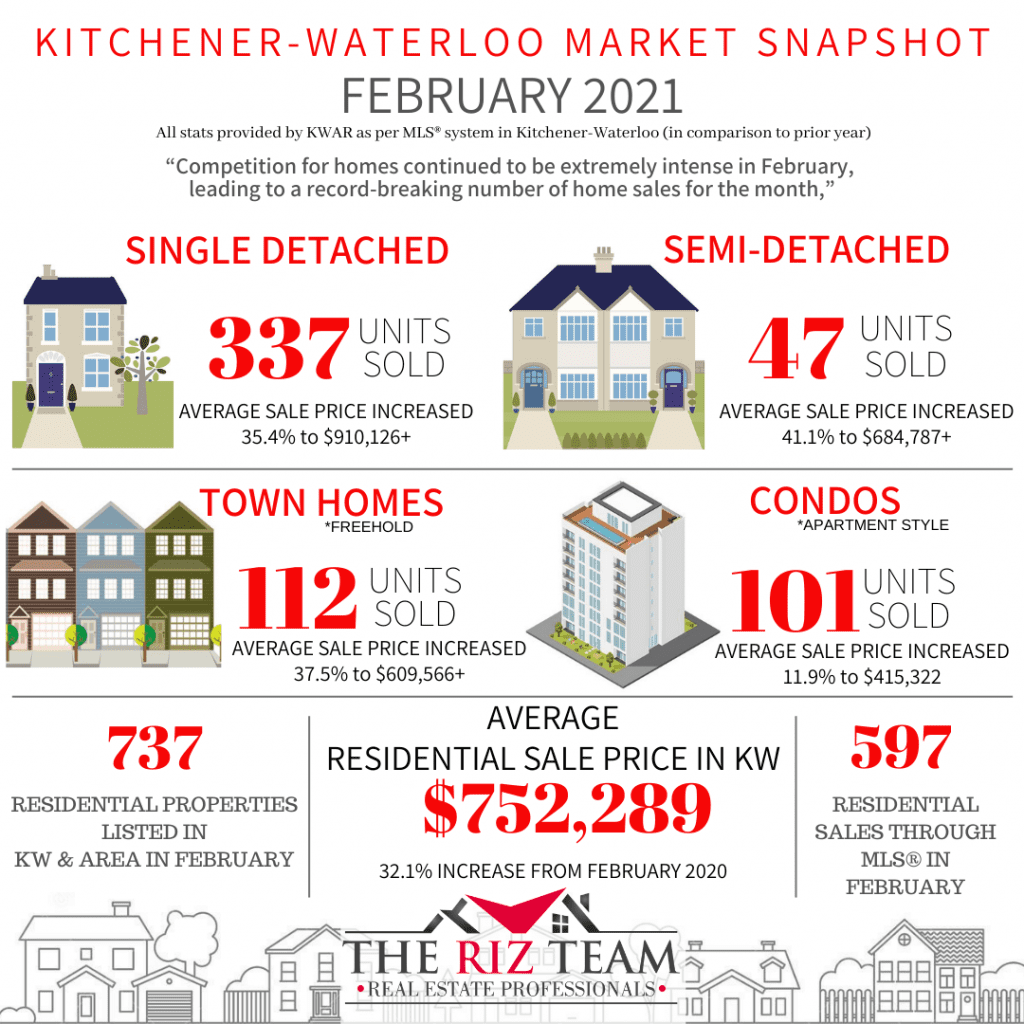
KITCHENER-WATERLOO, ON (Mar 4, 2021) ––There were 597 residential homes sold through the Multiple Listing Service® (MLS® System) of the Kitchener-Waterloo Association of REALTORS® in February, an increase of 27.8 per cent compared to February 2020, and an increase of 66.7 per cent compared to the previous month. The previous 10-year average number of residential sales for February is 407.

“Competition for homes continued to be extremely intense in February, leading to a record-breaking number of home sales for the month,” says Nicole Pohl, President of KWAR.

Total residential sales in February included 337 detached (up 23.9 per cent from February 2020), and 101 condominium units (up 57.8 per cent). Sales also included 47 semi-detached homes (up 46.9 per cent) and 112 townhouses (up 13.1 per cent).

In February, the average sale price of all residential properties sold in 2021 increased by 32.1 per cent to $752,289 compared to the same month last year. Meanwhile the average price of a detached home hit yet another new milestone by exceeding 900-thousand-dollars for the first time, coming in at $910,126 an increase of 35.4 per cent. During this same period, the average sale price for an apartment-style condominium was $415,322 for an increase of 11.9 per cent. Townhomes and semis sold for an average of $609,566 (up 37.5 per cent) and $684,787 (up 41.1 per cent) respectively.

“We continued to see dramatic increases in the average price in February due to the persistent and fierce competition for homes in our region combined with short supply,” says Pohl.

The president of KWAR notes that buyers are very frustrated competing in this hyperactive market. The low inventory and mortgage rates are resulting in multiple offers, higher prices and creating a fear they are missing out on the chance to become homeowners in this unprecedented market.

“The rise in the average price we’ve been tracking the past several months has included some exceptional sale prices. That’s why this month and going forward we will also be including the MLS® HPI to provide a clearer picture of our local housing market trends.”

The MLS® HPI is a sophisticated statistical model and more stable price indicator than average or median price measures because it considers how the features of a home affects its price – such as age, number of bedrooms, and number of bathrooms.

The MLS® Home Price Index composite benchmark price for all residential properties in Kitchener-Waterloo was $709,600 in February. This represents a 27.9 per cent increase over February 2020 and a 5.6 per cent increase compared to January 2021.

The benchmark price for a detached home was $788,500. This represents a 28.8 per cent increase from February 2020 and 6.1 per cent increase compared to January 2021.

The benchmark price for an apartment-style condominium was $341,200. This represents a 13.9 per cent increase from February 2020 and a 0.1 per cent increase compared to January 2021.

The benchmark price for a townhouse is $526,700. This represents a 33.1per cent increase from February 2020 and a 6 per cent increase compared to January 2021.

There were 737 new listings added to the MLS® System in KW and area last month, an increase of 21 per cent compared to February of last year, and a 15.7 per cent increase compared to the previous ten-year average for February.

The total number of homes available for sale in active status at the end of February was 295, a decrease of 33.6 per cent compared to February of last year, and 73 per cent below the previous ten-year average of 1,096 listings for February.

The number of months of inventory in Waterloo region was 0.5 in February and has numbered less than 1 month since October. The number of months of inventory represents how long it would take to sell off current inventories at the current rate of sales.

The average number of days to sell in February was 10 days, compared to 17 days in February 2020 and a previous 5-year average of 33 days.

The MLS® HPI provides the best way to gauge price trends because averages are strongly distorted by changes in the mix of sales activity from one month to the next. View our HPI tool here to learn more: https://kwar.ca/hpi-dashboard

Those requiring specific information on property values should contact a local REALTOR®. Working with a Realtor is the best way to get a complete picture of the property and community you are considering. View KWAR – CREA Residential Market Activity and MLS HPI Report

Historical Sales By Property Type

Months Supply of Homes for Sale 

Historical Median Sales Price – By Property Type 

Historical Average Sales Price – By Property Type

Average Days on Market

JANUARY HOME SALES SNOWED UNDER BY LOW INVENTORY

Wednesday, February 7th, 2018

The Riz Team January Stats

There were 270 residential sales in January through the Multiple Listing System (MLS® System) of the Kitchener-Waterloo Association of REALTORS® (KWAR), a decrease of 18 per cent compared to January 2017.

“On the surface, activity appears to be somewhat sluggish in January, says Tony Schmidt, KWAR President. “However if we set aside the past two years, it was a very typical January in terms of the number of sales. What is less typical is that listing inventory is still at historic low levels, and we continue to see multiple offers on properties putting upward pressure on prices.”

Total residential sales in January included 149 detached (down 23.6 per cent), and 70 condominium units (down 11.4 per cent) which includes any property regardless of style (i.e. semis, townhomes, apartment, detached etc.). Sales also included 27 semi-detached homes (down 18.2 per cent) and 22 freehold townhouses (up 10 per cent).

View Full Media Release

The Scoop on Home Inspections

Monday, November 27th, 2017

A home inspection, while not required in all areas, should be an indispensable part of your home buying or selling process. It is worth the cost up front to save you money and headaches down the road.

What a Home Inspection Entails

A home inspector will provide a thorough inspection of the home’s interior and exterior to alert you to any damage that may cause potential problems in the future. He or she will look at the house as a whole and evaluate how the different components work together and affect each other. The inspector will identify any areas that need repairs or are unsafe and advise you on what your next steps should be.

Benefits for a Home Buyer

When you are purchasing a home, you want to know that it is going to be safe for you and your family for many years to come. Obviously, you don’t want to buy a home that is rotting from the inside out. A home inspector can alert you to issues that are minor right now but could potentially become much more serious in the future. Purchasing a home is a major decision. The results of the inspection may lead you to reconsider buying a particular house if it is likely to have a lot of problems in the future. It can protect you from huge unexpected expenses.

Benefits for a Home Seller

If you are the one selling the home, it is a good idea to request a home inspection prior to listing your home on the market. Potential buyers of your home are likely to have an inspection done, and you don’t want there to be any surprises. If there are issues with the house, buyers may rescind their offers or make offers only on the condition that you repair the problems before they finalize the purchase. It is better if you know about any problems in advance. An inspection gives you the opportunity to make sure the house is in its best possible condition when buyers start coming to look at it. This will streamline the purchasing process and make potential buyers feel much more confident that your home is the right choice for them.

When you are ready to buy or sell a home, or have any questions regarding home inspections, get in touch!

Three Space-saving Upgrades

Monday, November 20th, 2017

Giving a Smaller Home a More Roomy Feel
Smaller rooms can create a decorating challenge for homeowners. While some may be dealing with a space that is smaller overall – such as an condo or apartment – others may have just a couple of smaller rooms that look and feel cramped. While enlarging these rooms may not be an option, there may be a few upgrades to consider that can give these rooms a more spacious and open feel.

Light Paint Colours

Dark colours can add dramatic flair to a room, and they certainly will make a bold statement. However, they also can create the feeling that the room is smaller than it is. It is best to paint with light paint colours on the walls or even to choose a lighter colour for the ceiling. In addition to these colours, a lighter floor colour can also add the feeling of depth to the space. If the use of bolder, brighter hues is preferred, consider adding a pattern in combination with lighter colours to the ceiling. Another idea is to use stripes with alternating darker and lighter hues on the walls to create the illusion of space.

Shelving Installed Close to the Ceiling

Storage space is often a concern with smaller rooms, and cabinets and bookshelves can take up valuable floor space in any room. A smart idea for smaller rooms is to install shelving or even cabinetry closer to the ceiling. This can enable the space below it to be kept open or to be used for other purposes, such as for other furnishings that must be kept on the floor.

Recessed or Flush Lighting

Lighting is an important element in any room, and brighter lighting can make a space look larger in many situations. Darker shadows cast about a room can make the space feel closed off. More than that, overhead lights that hang down, such as pendants or chandeliers, can create a visual illusion that makes the room feel smaller than it is.

To achieve the goal of casting light throughout the room more evenly while removing these hanging light fixtures from the space, install recessed or flush lights into the ceiling. These can be combined with small table lamps if necessary to brighten up any areas that may still be dark or shadowy. Avoid tall, imposing lamps when decorating a smaller room.

Decorating a smaller room is rarely easy to do, and there are many things that homeowners can do when decorating that actually may make a smaller room appear to be even smaller. These are a few tips that can be followed to make the space appear to be more roomy and spacious, but there are also other ideas for decorating as well as built-in upgrades to consider. Ideally, the fully decorated room will be stylish and functional as well as appear to be spacious.

With proper research and planning, a homeowner can achieve the desired results.

You Ask, We Answer: When is the Right Time to Upgrade to a Larger Home

Monday, November 13th, 2017

Upgrading to a Larger Home – Are you ready?

Many homebuyers face the question of size when looking for their next home. Do they downsize, stay the same, or upgrade to a larger home? To help answer this question, here are some factors to take into consideration when determining if you should upgrade to a larger home.


Affordability

With larger homes come more financial responsibility. Typically larger homes will come with a larger mortgage, repair/maintenance, utilities, and insurance payments as well as increased property taxes. Are you ready financially for these larger expenses? Take into account these estimated expenses when going over your household budget. Remember, ideally you’ll want to be able to maintain a comfortable quality of life and still be able to save for the future when these larger expenses are taken into account with your budget.


Down Payments

There is a need in most cases during the property buying process to make a down payment and to pay for closing costs. You should include these expenses in your estimations while keeping in mind that selling the existing property and accessing equity will yield most or all of the funds that are needed to make a new purchase. Working with a real estate professional and a mortgage broker will help you to get more information about these two factors before making a sound financial decision.

When the time is right for you to upgrade to a larger home, you should consider working with an experienced real estate agent to sell your existing property and help you in the process of buying a new home!

Why Use a REALTOR®?

Monday, November 6th, 2017

REALTORS® Streamline the Process of Selling Your Home

So, it is time to move onwards and upwards in life and move house! Moving is a dynamic process that involves much more than a simple transaction. From marketing to proper evaluations and inspections, it is advisable to use the services of an experienced professional realtor to make sure everything goes smoothly.

The following challenges are what a professional can help you avoid when selling your home:

Time Spent on Potential Buyers

Selling a home by yourself will be a significant time commitment that should not be underestimated. Perhaps the greatest commitment to your time will be in scheduling and hosting viewings of your property. Are you ready and able to pick up the phone every time you have an inquiry? Are you able to sift out the simply curious from real potential buyers to avoid unnecessary viewings? Realtors are experienced in asking the kind of qualifying questions that sort out the wheat from the chaff. And how many evenings, weekends, and weekday hours are you able to give up to show interested parties your home? You’ll then have to pro-actively follow up on interest after viewings.

Marketing and Valuation

As well as the time involved in doing your own marketing, there are also practical considerations around how successfully you will get the information out there. Yes, you can list your property on various websites and specialist portals that realtors use. However, realtors also have extended networks of active potential buyers that they will reach out to with information on your property, a channel you will almost certainly not have access to.

You would have to be confident that you could realistically value your property correctly if you chose to put your home on the market yourself. Things you may be oblivious to can be widely considered as flaws by potential buyers. A professional realtor has the experience to point those out and suggest small changes which will make your property more attractive.

Negotiating

Realtors are both objective and experienced, having negotiated hundreds or thousands of real estate transactions. They know how to spot the signs a potential buyer has formed an emotional attachment towards your property and how to leverage that to your benefit. They also know how to spot signs of nervousness that might pose a threat to the eventual sale and how best to allay such fears. They won’t make compromises because they have been charmed by a prospective buyer, or behave irrationally because they don’t like them on a personal level.

Avoiding Getting Sued

This is a genuine concern that owners operating without a realtor must be acutely aware of. There is a lot of paperwork involved in the sale of a property. Getting it wrong can at best delay the sale and at worst lead to putting yourself in danger of legal proceedings. Seller’s disclosure is a particular concern. What can be considered a defect, hazard, or nuisance varies depending on where you live. Realtors know exactly what is required of the seller. If a mistake is made, then they have insurance, ensuring that a seller does not personally suffer.

Selling your home in the Kitchener/Waterloo, Alberta area? Local real estate agent Riz Jadavji can ensure that you have a successful experience selling your home!

Steady Home Sales in August….

Friday, September 8th, 2017

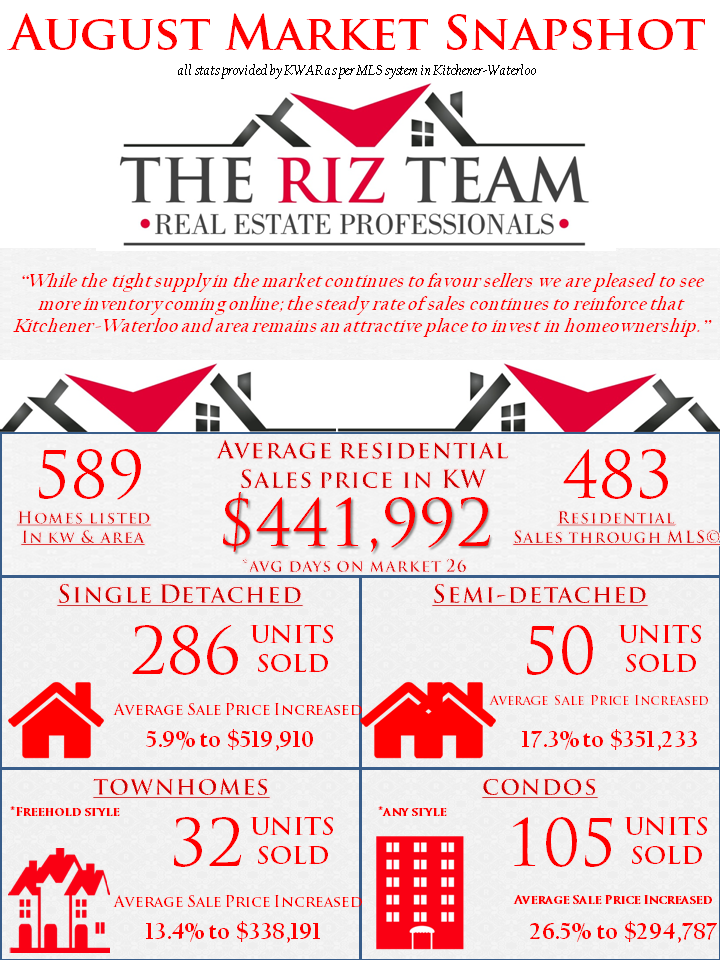
A total of 483 residential sales occurred through the Multiple Listing System (MLS® System) of the Kitchener-Waterloo Association of REALTORS® (KWAR) in August. This was 19.2 per cent below August 2016’s record breaking 598 units sold but still ahead of the previous 5-year August average of 473 sales. Residential sales last month brings a year-to-date total of 4,876 residential units, an increase of 3.7 per cent compared to 2016. “I think we’re seeing some stability return to the market” says James Craig, President of KWAR. “Last summer’s record setting sales was unsustainable and created a market that no one enjoyed.”

The Riz Team Market Update August 2017


© Copyright 2017, Real Estate Websites by Redman Technologies Inc. | Privacy Policy | Disclaimer | Sitemap

MLS®, REALTOR®, and the associated logos are trademarks of The Canadian Real Estate Association.

The data included on this website is deemed to be reliable, but is not guaranteed to be accurate by the Kitchener-Waterloo Real Estate Board. The trademarks REALTOR®, REALTORS® and the REALTOR® logo are controlled by The Canadian Real Estate Association (CREA) and identify real estate professionals who are members of CREA. Used under license.