Posts Tagged ‘sellers’
Thursday, October 3rd, 2024
Waterloo Region Sees Decrease in Home Sales for September
In September, a total of 521 homes were sold in the Waterloo Region via the Multiple Listing Service® (MLS®) System of the Cornerstone Association of REALTORS® (Cornerstone). This represents a decrease of 2.1 per cent compared to the same period last year and a decline of 23.5 per cent compared to the average number of homes sold in the previous ten years for the same month.
“In September, there was an overall slowdown in home sales, but we continued to see strong demand for detached homes, resulting in an increase in sales for that specific type of property,” said Christal Moura, spokesperson for the Waterloo Region market area. “Meanwhile, buyers have a bit more selection than a year ago as inventory is up, and homes take a little longer to sell. This can mean a less stressful homebuying experience, but for sellers, the current market may require more patience or even adjustment in price expectation.”
If you are considering to Sell your home or Buy a home in the next short while it would be highly beneficial for you to connect with one of our Team Agents at
Do you want to know what your home is worth today? Click Below for our Online No Obligation Market Evaluation
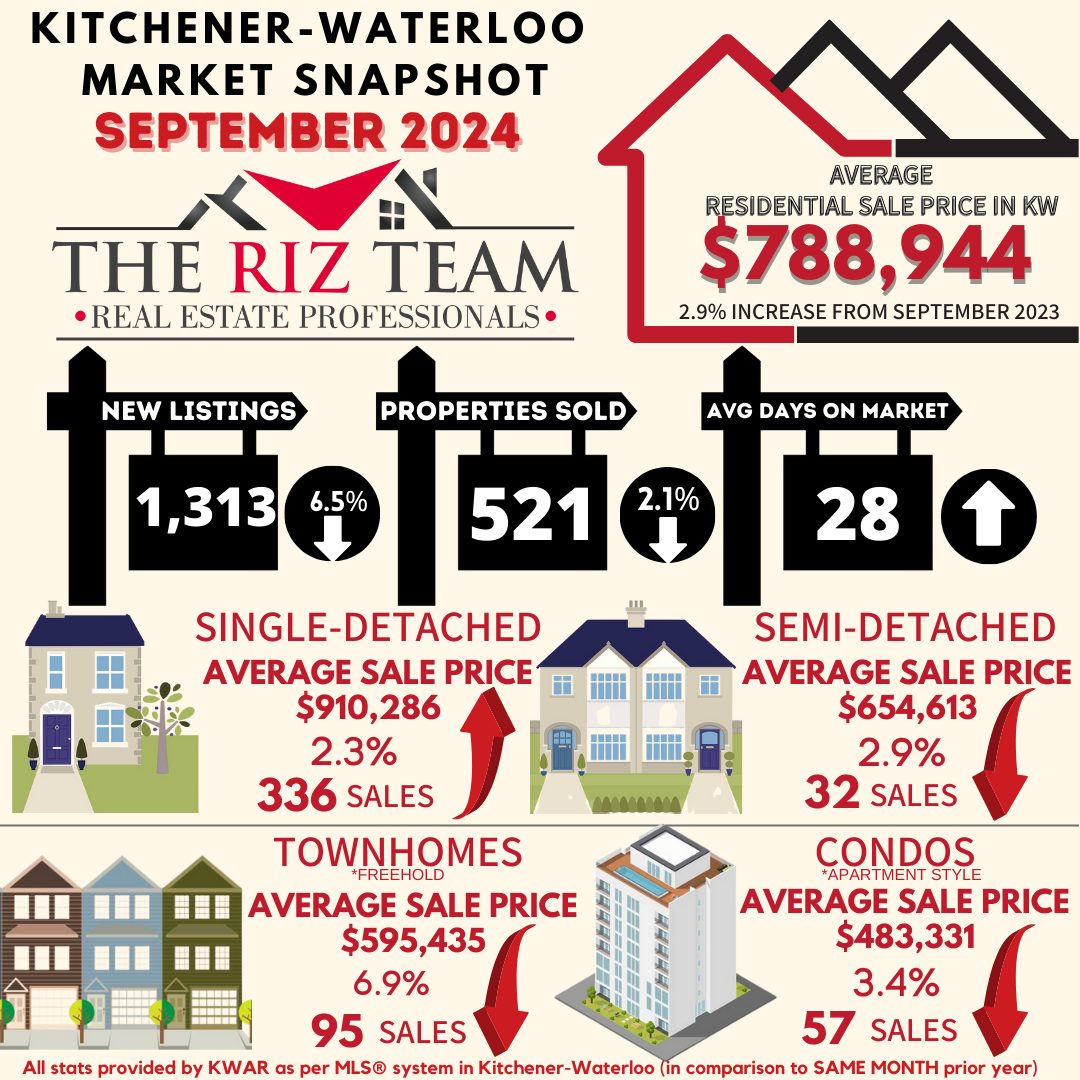
Total residential sales in September included 336 detached homes (up 9.4 per cent from September 2023), and 95 townhouses (down 22.1 per cent). Sales also included 57 condominium units (down 16.2 per cent) and 32 semi-detached homes (down 3.0 per cent).
In September, the average sale price for all residential properties in Waterloo Region was $788,944. This represents a 2.9 per cent increase compared to September 2023 and a 2.3 per cent increase compared to August 2024.
- The average price of a detached home was $910,286. This represents a 2.3 per cent increase from September 2023 and an increase of 2.2 per cent compared to August 2024.
- The average sale price for a townhouse was $595,435. This represents a 6.9 per cent decrease from September 2023 and a decrease of 2.7 per cent compared to August 2024.
- The average sale price for an apartment-style condominium was $483,331. This represents a decrease of 3.4 per cent from September 2023 and an increase of 4.9 per cent compared to August 2024.
- The average sale price for a semi was $654,613. This represents a decrease of 2.9 per cent compared to September 2023 and an increase of 0.1 per cent compared to August 2024.

MLS® Home Price Index Benchmark Price
|
|
Kitchener-Waterloo |
Cambridge |
| Benchmark Type: |
September 2024 |
Monthly % Change |
Yr./Yr. % Change |
September 2024 |
Monthly % Change |
Yr./Yr. % Change |
| Composite |
$728,700 |
0.2 |
-1.8 |
$741,800 |
-0.1 |
0.0 |
| Single Family |
$844,400 |
0.6 |
0.3 |
$777,500 |
0.2 |
1.3 |
| Townhouse |
$602,800 |
-0.7 |
-5.5 |
$641,700 |
-1.7 |
-4.8 |
| Apartment |
$435,700 |
-1.3 |
-8.3 |
$481,500 |
-0.2 |
-4.2 |

In September, Cornerstone welcomed policy changes from the federal government. These changes include extending mortgage terms to 30 years for first-time homebuyers and all buyers of new builds and raising the CMHC insurance cap from $1 million to $1.5 million. These changes will come into effect later this year. Combined with anticipated further interest rate cuts, these adjustments could enable more buyers to purchase their first home.
There were 1,313 new listings added to the MLS® System in Waterloo Region last month, a decrease of 6.5 per cent compared to September last year and a 20.0 per cent increase compared to the previous ten-year average for September.
The total number of homes available for sale in active status at the end of September was 1,751 an increase of 21.3 per cent compared to September of last year and 42.2 per cent above the previous ten-year average of 1,232 listings for September.
The total inventory across the market increased by 23.1 percent, resulting in a 3.2-month supply of all property types by the end of September. Condominium apartments had the highest inventory, with 5.5 months’ supply, followed by townhouses with 3.6 months’ supply and detached homes with 2.7 months’ supply. The number of months of inventory represents the time it would take to sell off current inventories at the current sales rate.
The average time it took to sell a home in September was 28 days, which is three days longer than the previous month. In September 2023, it took 19 days for a home to sell, and the five-year average is 18 days.
Cornerstone emphasizes the importance of consulting a local REALTOR® when considering buying or selling property in the Waterloo Region. Their expertise can provide valuable insights into the current market conditions, enabling individuals to make well-informed decisions aligned with their goals and preferences.


Tags: buyers, for sale, home sales, kitchener, kitchener real estate, kitchener-waterloo, KW Market Update, KW Real Estate, real estate, riz jadavji, Royal Lepage Wolle Realty, sales representative, sellers, the riz team, waterloo, Waterloo Buyers, Waterloo Sellers, www.rizsellskw.com
Posted in Kitchener Buyers, Kitchener Sellers, Market Stats, Market Update, Real Estate News, Realtor Tips, Waterloo Buyers, Waterloo Sellers | Comments Off on Kitchener Waterloo Market Snapshot September 2024
Thursday, September 5th, 2024
Waterloo Region Sees Strong Demand for Detached Homes Amid Cooler Residential Sales in August
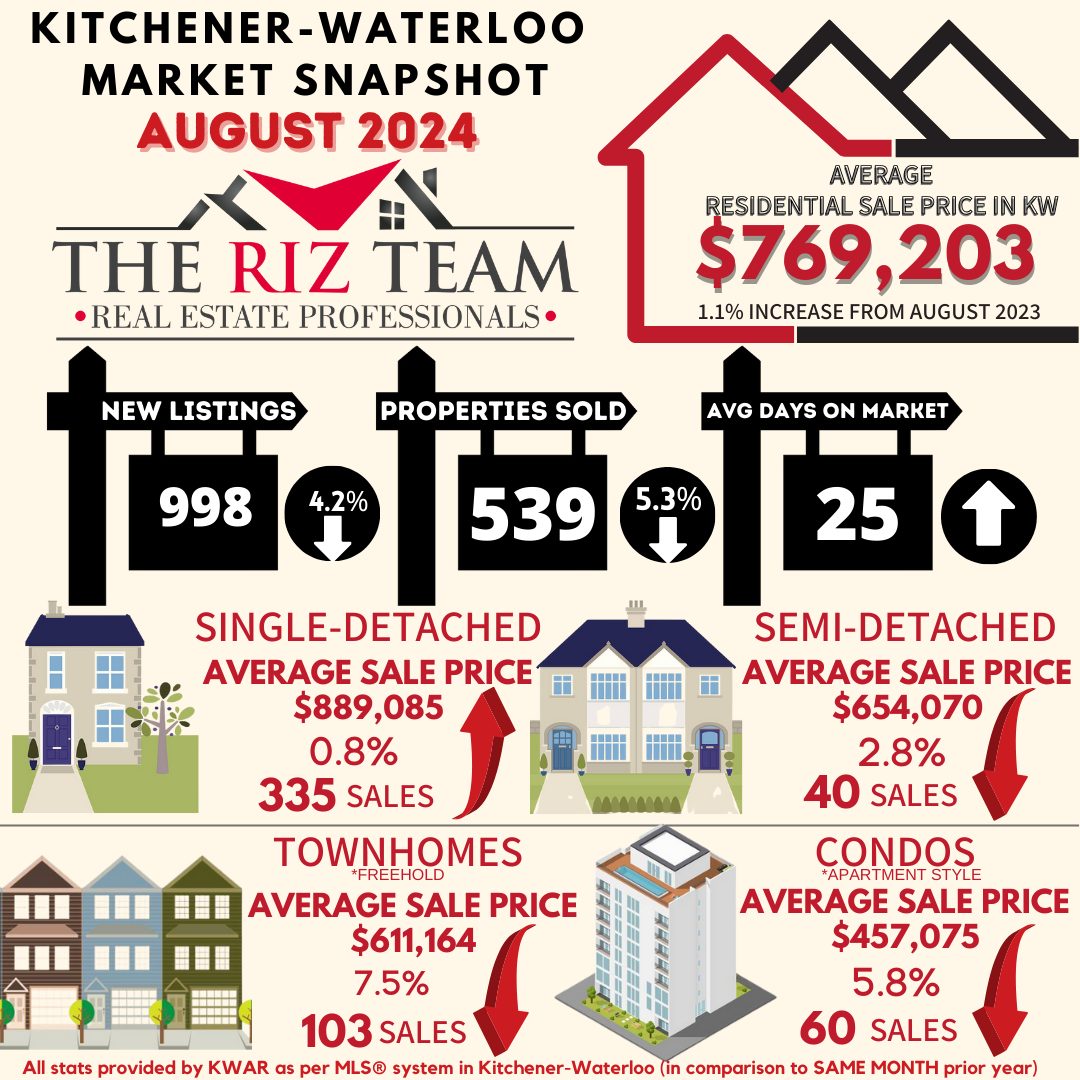
In August, a total of 539 homes were sold in the Waterloo Region via the Multiple Listing Service® (MLS®) System of the Cornerstone Association of REALTORS® (Cornerstone). This represents a decrease of 5.3 per cent compared to the same period last year and a decline of 24.1 per cent compared to the average number of homes sold in the previous ten years for the same month.
“Despite a cooling market, detached homes continue to see strong demand, reflected in a 6.0 percent increase in sales year-over-year,” says Christal Moura, spokesperson for the Waterloo Region market area. “With home prices showing stability in recent months and interest rates decreasing, we saw some home buyers finally come out from the wings to take advantage of the summer slowdown to seek out specific property types, like single-family homes.”
If you are considering to Sell your home or Buy a home in the next short while it would be highly beneficial for you to connect with one of our Team Agents at
Do you want to know what your home is worth today? Click Below for our Online No Obligation Market Evaluation
WATERLOO REGION, ON (September 5, 2024) —In August, a total of 539 homes were sold in the Waterloo Region via the Multiple Listing Service® (MLS®) System of the Cornerstone Association of REALTORS® (Cornerstone). This represents a decrease of 5.3 per cent compared to the same period last year and a decline of 24.1 per cent compared to the average number of homes sold in the previous ten years for the same month.
“Despite a cooling market, detached homes continue to see strong demand, reflected in a 6.0 percent increase in sales year-over-year,” says Christal Moura, spokesperson for the Waterloo Region market area. “With home prices showing stability in recent months and interest rates decreasing, we saw some home buyers finally come out from the wings to take advantage of the summer slowdown to seek out specific property types, like single-family homes.”
Total residential sales in August included 335 detached homes (up 6.0 per cent from August 2023), and 103 townhouses (down 22.6 per cent). Sales also included 60 condominium units (down 18.9 per cent) and 40 semi-detached homes (down 11.1 per cent).
In August, the average sale price for all residential properties in Waterloo Region was $769,203. This represents a 1.1 per cent increase compared to August 2023 and a 1.7 per cent decrease compared to July 2024.
- The average price of a detached home was $889,085. This represents a 0.8 per cent increase from August 2023 and a decrease of 2.7 per cent compared to July 2024.
- The average sale price for a townhouse was $611,164. This represents a 7.5 per cent decrease from August 2023 and a decrease of 1.5 per cent compared to July 2024.
- The average sale price for an apartment-style condominium was $457,075. This represents a decrease of 5.8 per cent from August 2023 and a decrease of 7.7 per cent compared to July 2024.
- The average sale price for a semi was $654,070. This represents a decrease of 2.8 per cent compared to August 2023 and a decrease of 1.9 per cent compared to July 2024.


ABOUT CORNERSTONE
Cornerstone Association of REALTORS® (Cornerstone) is a brand-new, novel association formed on July 1, 2024. Representing REALTORS® serving in the markets of Mississauga, Burlington, Hamilton, Waterloo Region, Niagara North, Haldimand County, Norfolk County and surrounding areas, it will become Ontario’s second-largest real estate board comprised of nearly 9,000 REALTORS®.
Established to better serve and represent REALTORS®, its vision is to establish a new, more influential, capable, and member-centric organization designed to meet the evolving needs of REALTORS® and help them thrive in the marketplace.
Cornerstone stands for transparency, honesty, and integrity. By taking a proactive stance toward the future and not being afraid to question some of the long-standing assumptions, Cornerstone offers a unique value proposition, paving the way for members’ brighter future.
We are Cornerstone. REALTORS® Together, Stronger Together.
More information at www.cornerstone.inc
Tags: buyers, for sale, home sales, kitchener, kitchener real estate, kitchener-waterloo, KW Market Update, real estate, riz jadavji, Royal Lepage Wolle Realty, sales representative, sellers, the riz team, waterloo, Waterloo Buyers, waterloo real estate, Waterloo Sellers, www.rizsellskw.com
Posted in Kitchener Buyers, Kitchener Sellers, Market Stats, Market Update, Real Estate News, Realtor Tips, Waterloo Buyers, Waterloo Sellers | Comments Off on Kitchener Waterloo Market Snapshot August 2024
Tuesday, August 6th, 2024
Waterloo Region Housing Market Sees Modest Sales Uptick in July Amid Lower Interest Rates and Increased Inventory
“In July, we observed a slight increase in home sales year-over-year following a reduction in interest rates, which seems to have provided a modest boost to market activity,” says Christal Moura, spokesperson for the Waterloo Region market area. “While this uptick is encouraging, it is evident that many potential buyers are adopting a wait-and-see approach, anticipating further decreases in interest rates and better buying conditions in the near future.”
If you are considering to Sell your home or Buy a home in the next short while it would be highly beneficial for you to connect with one of our Team Agents at
Do you want to know what your home is worth today? Click Below for our Online No Obligation Market Evaluation
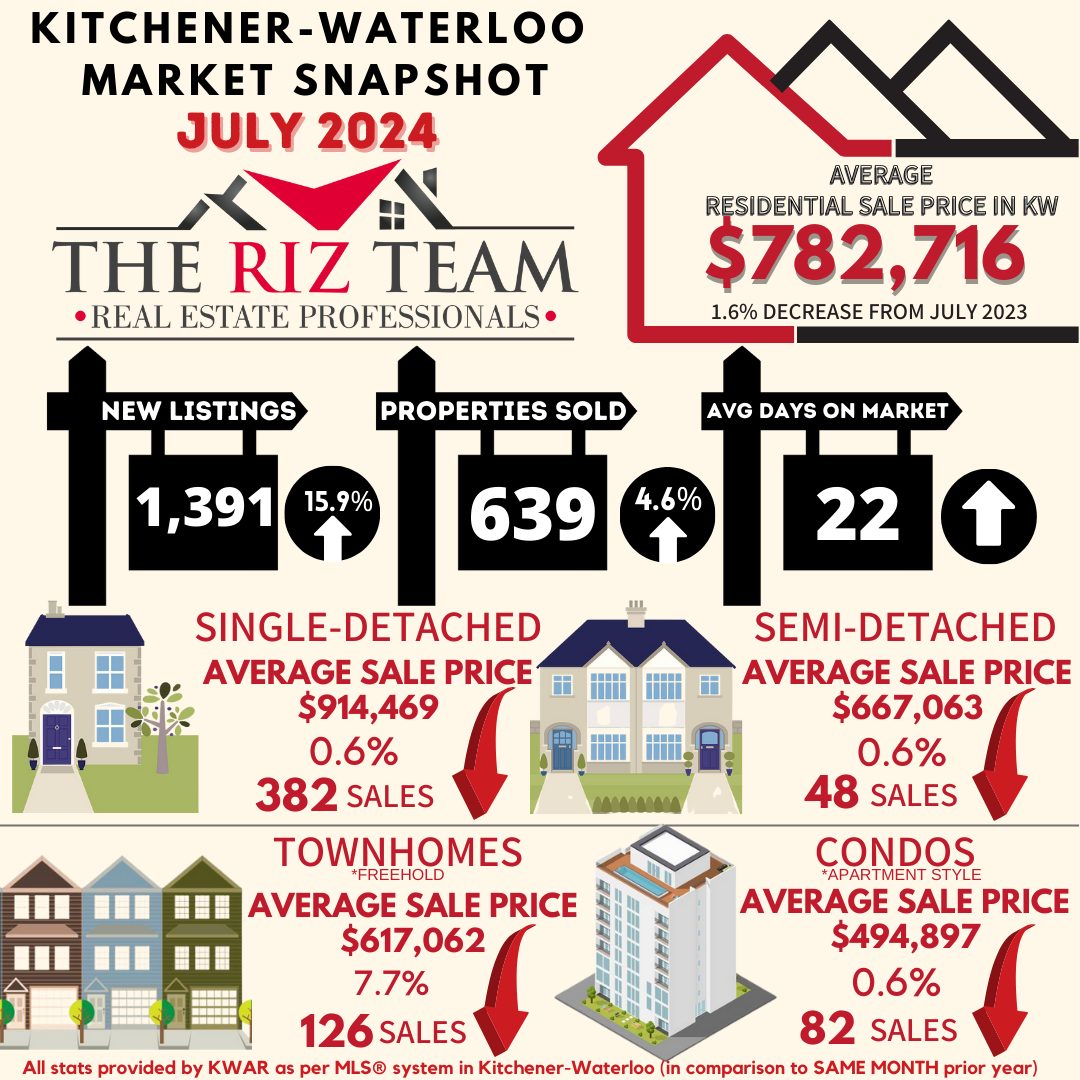
WATERLOO REGION, ON (August 6, 2024) —In July, a total of 639 homes were sold in the Waterloo Region via the Multiple Listing Service® (MLS®) System of the Cornerstone Association of REALTORS® (Cornerstone). This represents an increase of 4.6 per cent compared to the same period last year and a decline of 16.6 per cent compared to the average number of homes sold in the previous ten years for the same month.
“In July, we observed a slight increase in home sales year-over-year following a reduction in interest rates, which seems to have provided a modest boost to market activity,” says Christal Moura, spokesperson for the Waterloo Region market area. “While this uptick is encouraging, it is evident that many potential buyers are adopting a wait-and-see approach, anticipating further decreases in interest rates and better buying conditions in the near future.”
Total residential sales in July included 382 detached homes (up 4.1 per cent from July 2023), and 126 townhouses (up 5.0 per cent). Sales also included 82 condominium units (up 9.3 per cent) and 48 semi-detached homes (up 9.1 per cent).
In July, the average sale price for all residential properties in Waterloo Region was $782,716. This represents a 1.6 per cent decrease compared to July 2023 and a 0.9 per cent decrease compared to June 2024.
- The average price of a detached home was $914,469. This represents a 0.6 per cent decrease from July 2023 and an increase of 1.6 per cent compared to June 2024.
- The average sale price for a townhouse was $617,062. This represents a 7.7 per cent decrease from July 2023 and a decrease of 7.1 per cent compared to June 2024.
- The average sale price for an apartment-style condominium was $494,897. This represents a decrease of 0.6 per cent from July 2023 and an increase of 7.1 per cent compared to June 2024.
- The average sale price for a semi was $667,063. This represents a decrease of 0.6 per cent compared to July 2023 and an increase of 2.7 per cent compared to June 2024.


Cornerstone Association of REALTORS® cautions that average sale price information can help identify long-term trends but should not be to indicate that specific properties have increased or decreased in value. The average sale price is calculated based on the total dollar volume of all properties sold. Months Supply is the inventory of homes for sale at the end of a given month, divided by the average monthly closed sales from the last 12 months. Those requiring specific information on property values should contact a Waterloo Region REALTOR®. REALTORS® have their fingers on the pulse of the market. They know the questions to ask, the areas to probe and what to look for so that you get a complete picture of the property and community you’re considering.
ABOUT CORNERSTONE
Cornerstone Association of REALTORS® (Cornerstone) is a brand-new, novel association formed on July 1, 2024. Representing REALTORS® serving in the markets of Mississauga, Burlington, Hamilton, Waterloo Region, Niagara North, Haldimand County, Norfolk County and surrounding areas, it will become Ontario’s second-largest real estate board comprised of nearly 9,000 REALTORS®.
Established to better serve and represent REALTORS®, its vision is to establish a new, more influential, capable, and member-centric organization designed to meet the evolving needs of REALTORS® and help them thrive in the marketplace.
Cornerstone stands for transparency, honesty, and integrity. By taking a proactive stance toward the future and not being afraid to question some of the long-standing assumptions, Cornerstone offers a unique value proposition, paving the way for members’ brighter future.
We are Cornerstone. REALTORS® Together, Stronger Together.
More information at www.cornerstone.inc
Tags: buyers, for sale, home sales, kitchener, kitchener real estate, kitchener-waterloo, KW Market Update, real estate, riz jadavji, rizsellskw, Royal Lepage Wolle Realty, sales representative, sellers, the riz team, waterloo, Waterloo Buyers, waterloo real estate, Waterloo Sellers, www.rizsellskw.com
Posted in Kitchener Buyers, Kitchener Sellers, Market Stats, Market Update, Real Estate News, Realtor Tips, Waterloo Buyers, Waterloo Sellers | Comments Off on Kitchener Waterloo Market Snapshot July 2024
Thursday, July 6th, 2023
Waterloo Region Real Estate Market Shows Resilience With Increase in Home Sales and Average Prices
If you are considering to Sell your home or Buy a home in the next short while it would be highly beneficial for you to connect with one of our Team Agents at
Do you want to know what your home is worth today? Click Below for our Online No Obligation Market Evaluation
Tags: buyers, for sale, Homes For Sale, Kitchener Buyers, kitchener real estate, kitchener-waterloo, Market Update, real estate market, sales representative, sellers, the riz team, waterloo for sale, Waterloo Homes, Waterloo Sellers
Posted in Kitchener Buyers, Kitchener Sellers, Market Stats, Market Update, Real Estate News, Waterloo Buyers, Waterloo Sellers | Comments Off on Kitchener Waterloo Market Snapshot June 2023
Thursday, January 5th, 2023
Fewer Homes Sales in December Ends a Year of Weaker Sales Activity in Waterloo Region
If you are considering to Sell your home or Buy a home in the next short while it would be highly beneficial for you to connect with one of our Team Agents at
Do you want to know what your home is worth today? Click Below for our Online No Obligation Market Evaluation
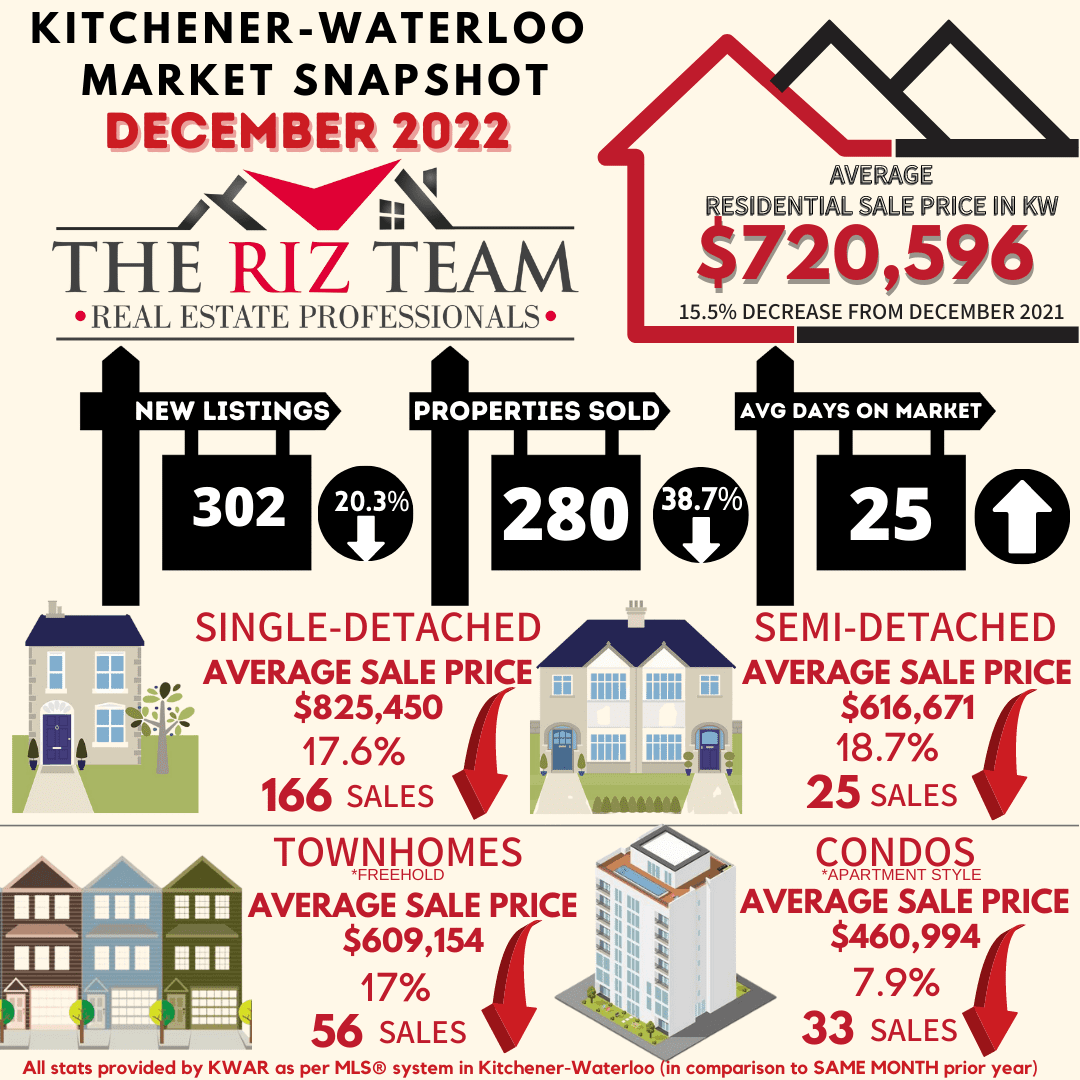
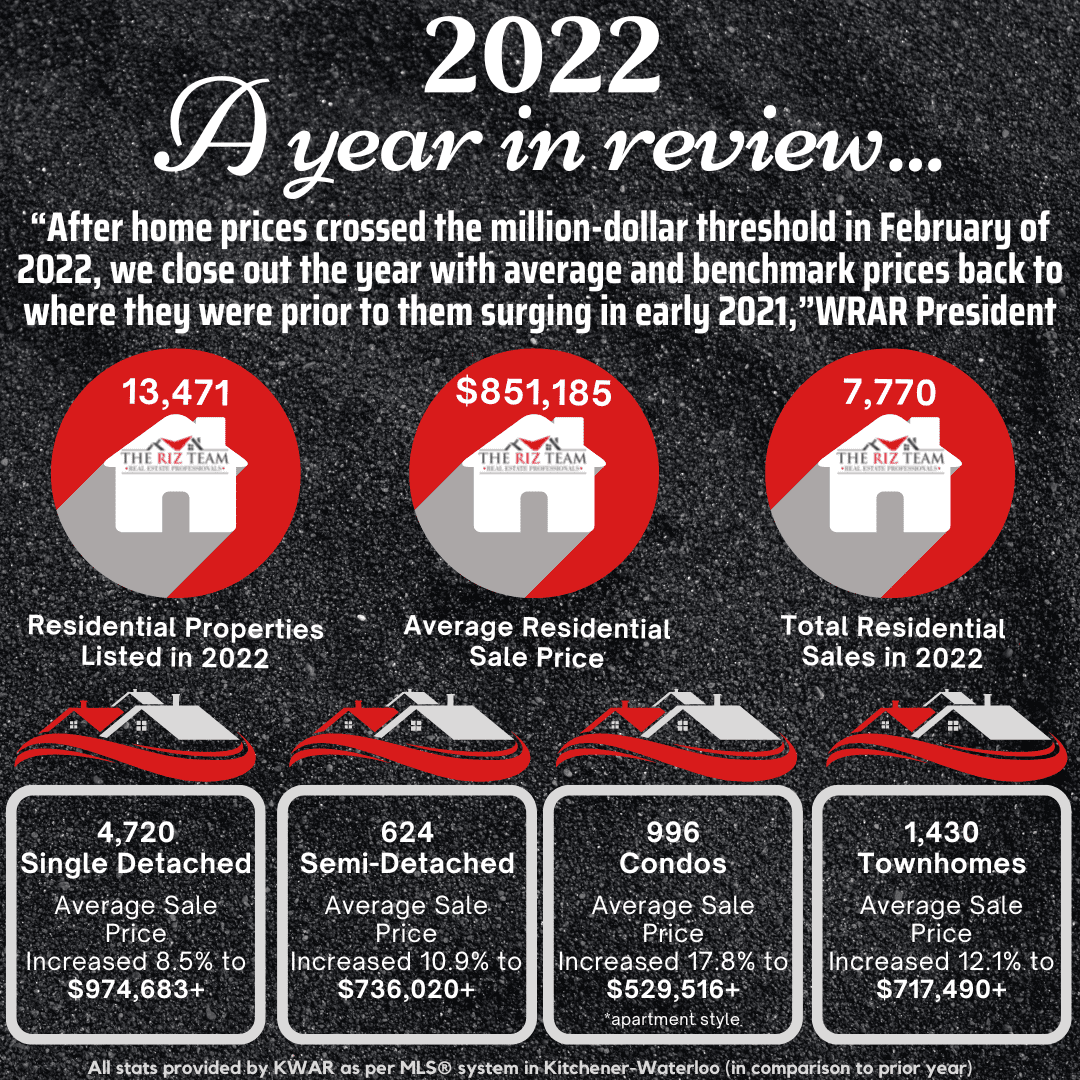
WATERLOO REGION, ON (January 5, 2023) —There were 7,770 homes sold through the Multiple Listing Service® (MLS®) System of the Waterloo Region Association of REALTORS® (WRAR) in 2022, a decrease of 24.8 per cent compared to 2021. On a historical basis, 2022 performed lower than previous years, with annual sales down 12.4 per cent compared to the previous 5-year average and 8.2 per cent below the previous 10-year average.
On a monthly basis, there were 280 homes sold in December, a decrease of 38.7 per cent compared to December 2021, and 32.3 per cent below the previous 5-year average for the month.
“The number of homes sold in December was lower than any single month in well over a decade, marking an end to a turbulent year for home sales in Waterloo Region,” says Megan Bell, President of WRAR.

Tags: buyers, first-time buyers, homes, Kitchener Buyers, kitchener real estate, Kitchener Sellers, kitchener-waterloo, Re/Max, Royal Lepage Wolle Realty, sellers, waterloo real estate, Waterloo Sellers, Zillow
Posted in Kitchener Buyers, Kitchener Sellers, Market Stats, Market Update, Real Estate News, Realtor Tips, Uncategorized, Waterloo Buyers, Waterloo Sellers | Comments Off on Kitchener Waterloo Market Snapshot & Yearly Summary December 2022
Wednesday, October 5th, 2022
Fewer Home Sales in October
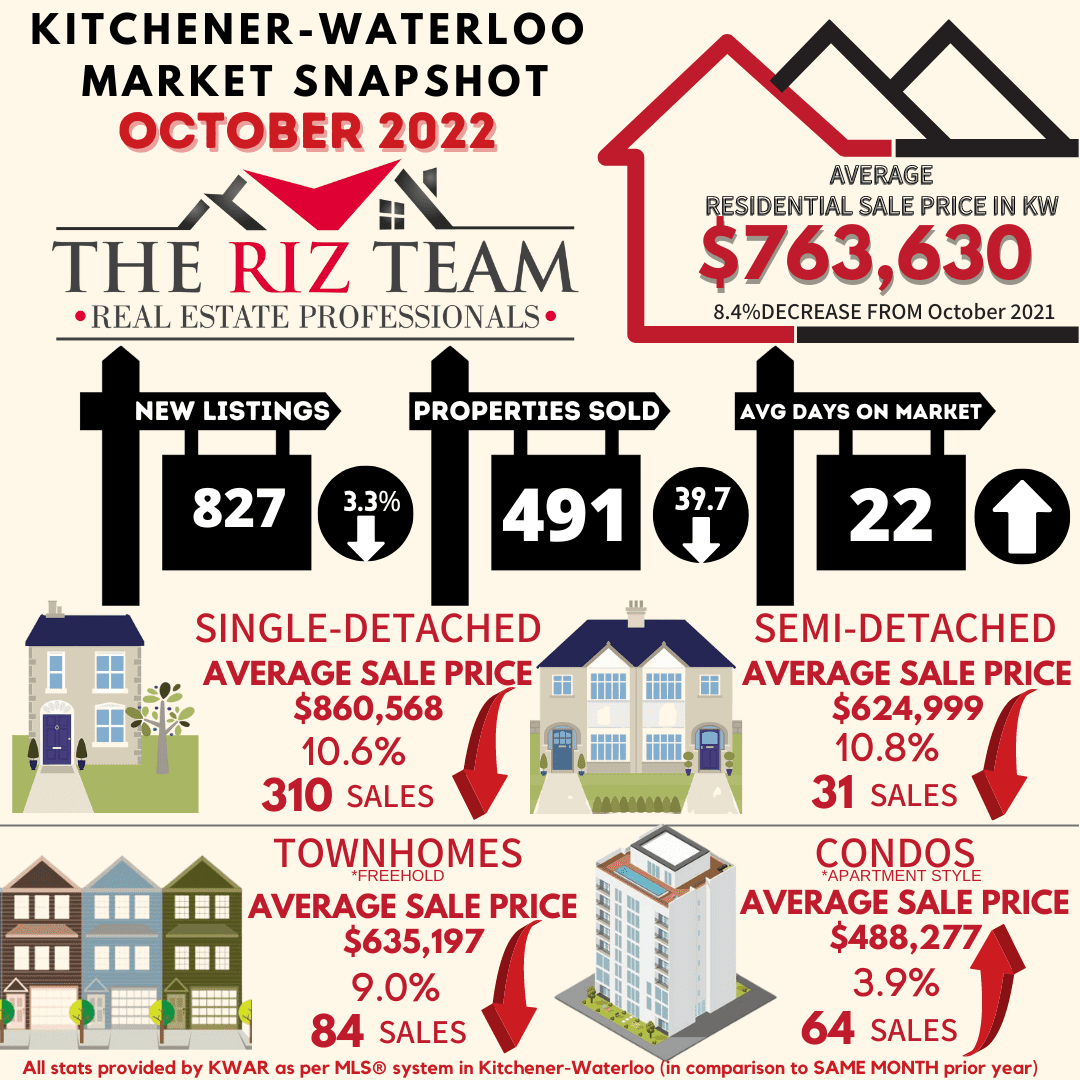
“Unsurprisingly, the pace of home sales continued to slow in October after the Bank of Canada’s sixth straight interest rate hike in September,” says Megan Bell, President of WRAR. “Faced with higher borrowing costs, some buyers have had to re-assess what they can afford. As these buyers get moved to the sidelines, sellers question if now is the best possible time to sell.”
If you are considering to Sell your home or Buy a home in the next short while it would be highly beneficial for you to connect with one of our Team Agents at
Do you want to know what your home is worth today? Click Below for our Online No Obligation Market Evaluation
Tags: buyers, kitchener, Kitchener Buyers, kitchener real estate, Kitchener Sellers, kitchener-waterloo, kitchener-waterloo association of realtors, KW Real Estate, Market Stats, real estate, rizsellskw.com, sellers, the riz team, TheRizTeam, waterloo real estate
Posted in Enhance Your Home, Kitchener Buyers, Kitchener Sellers, Market Stats, Market Update, Real Estate News, Realtor Tips, Uncategorized, Waterloo Buyers, Waterloo Sellers | Comments Off on Kitchener Waterloo Market Snapshot October 2022
Wednesday, September 7th, 2022
Rising Borrowing Costs Continue to Tame Home Sales in August
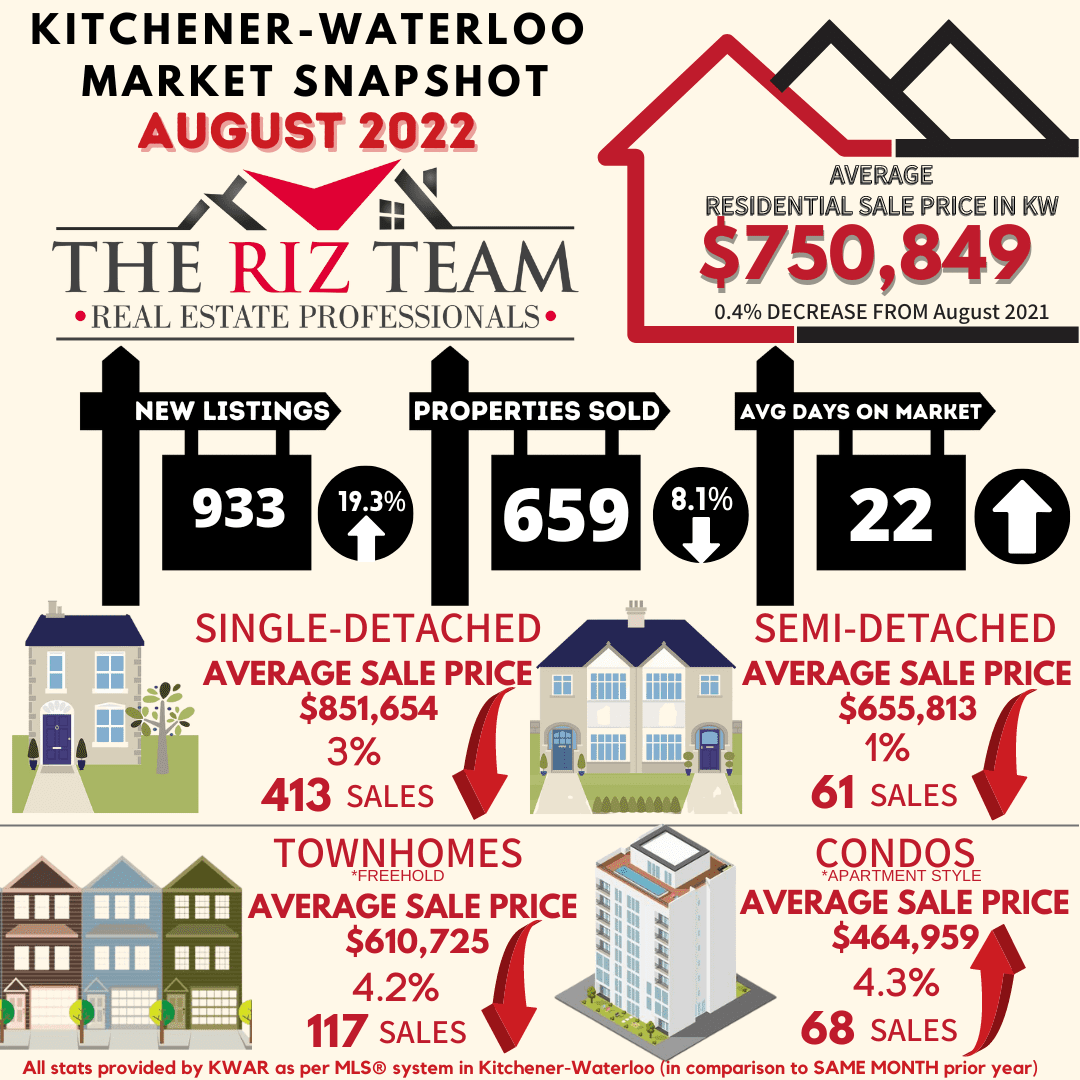
“The decline was most pronounced in the apartment-style condo and townhouse categories which could indicate that rising borrowing costs are having a greater impact on first-time buyers and those looking for more affordable options.”
If you are considering to Sell your home or Buy a home in the next short while it would be highly beneficial for you to connect with one of our Team Agents at
Do you want to know what your home is worth today? Click Below for our Online No Obligation Market Evaluation
Tags: buyers, kitchener, Kitchener Buyers, kitchener real estate, Kitchener Sellers, kitchener-waterloo, kitchener-waterloo association of realtors, KW Real Estate, Market Stats, real estate, rizsellskw.com, sellers, the riz team, TheRizTeam, waterloo real estate
Posted in Enhance Your Home, Kitchener Buyers, Kitchener Sellers, Market Stats, Market Update, Real Estate News, Realtor Tips, Uncategorized, Waterloo Buyers, Waterloo Sellers | Comments Off on Kitchener Waterloo Market Snapshot August 2022
Friday, August 5th, 2022
“In the wake of July’s interest rate hike, home sales in Waterloo Region continued to slow,” says Megan Bell, President of WRAR. “We’re seeing a clear shift in the market and what people can afford to purchase or are willing to pay. On the bright side for buyers, it’s not the extreme sellers’ market it was.”
If you are considering to Sell your home or Buy a home in the next short while it would be highly beneficial for you to connect with one of our Team Agents at
Do you want to know what your home is worth today? Click Below for our Online No Obligation Market Evaluation

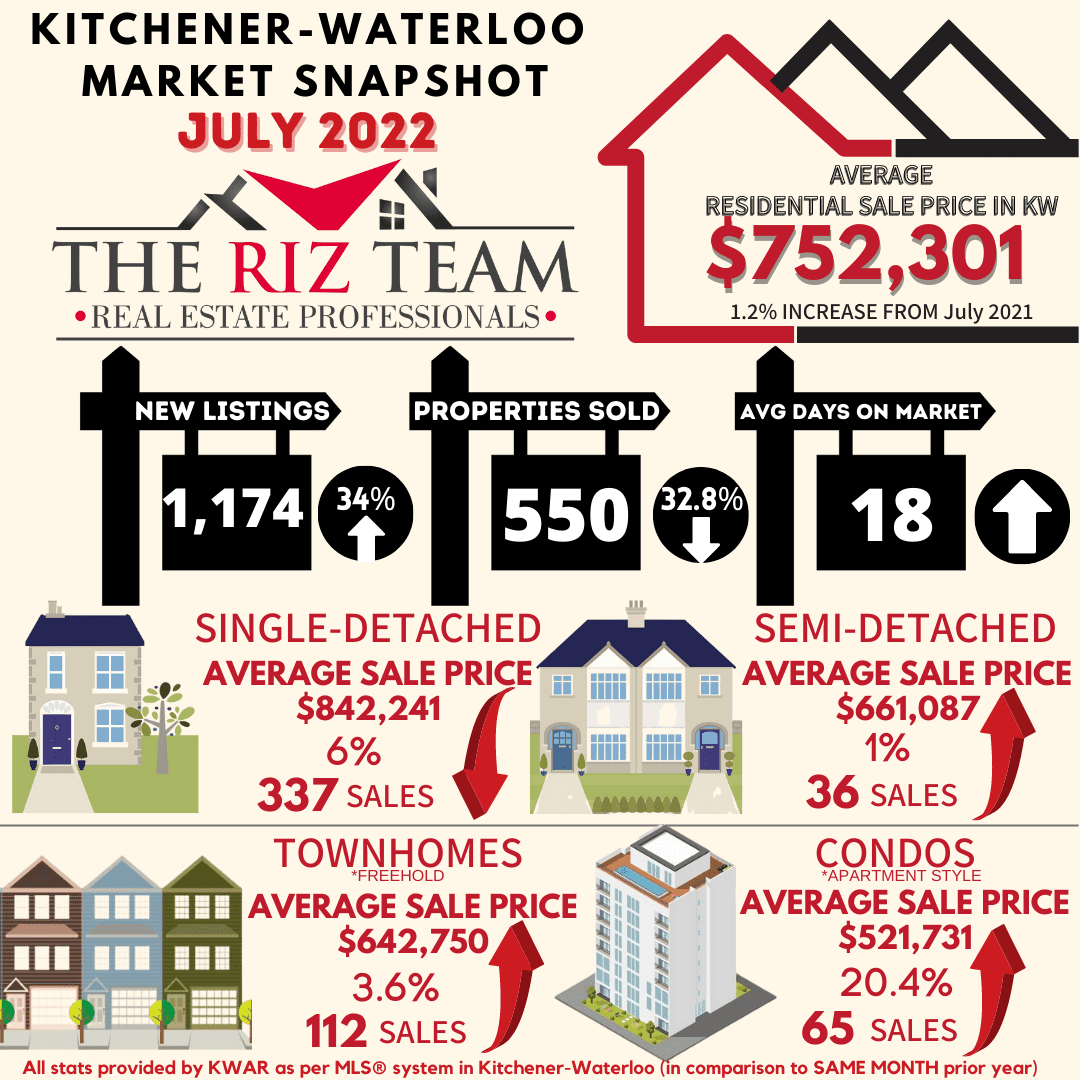
WATERLOO REGION, ON (August 5, 2022) — 550 residential homes were sold through the Multiple Listing Service® (MLS®) System of the Waterloo Region Association of REALTORS® (WRAR) in July, a decrease of 32.8 per cent compared to July 2021, and 32.3 per cent below the previous 5-year average for the month.
Tags: buyers, kitchener, Kitchener Buyers, kitchener real estate, Kitchener Sellers, kitchener-waterloo, kitchener-waterloo association of realtors, KW Real Estate, Market Stats, real estate, rizsellskw.com, sellers, the riz team, TheRizTeam, waterloo real estate
Posted in Kitchener Buyers, Kitchener Sellers, Market Stats, Market Update, Real Estate News, Realtor Tips, Waterloo Buyers, Waterloo Sellers | Comments Off on Kitchener Waterloo Market Snapshot July 2022
Wednesday, February 7th, 2018

The Riz Team January Stats
There were 270 residential sales in January through the Multiple Listing System (MLS® System) of the Kitchener-Waterloo Association of REALTORS® (KWAR), a decrease of 18 per cent compared to January 2017.
“On the surface, activity appears to be somewhat sluggish in January, says Tony Schmidt, KWAR President. “However if we set aside the past two years, it was a very typical January in terms of the number of sales. What is less typical is that listing inventory is still at historic low levels, and we continue to see multiple offers on properties putting upward pressure on prices.”
Total residential sales in January included 149 detached (down 23.6 per cent), and 70 condominium units (down 11.4 per cent) which includes any property regardless of style (i.e. semis, townhomes, apartment, detached etc.). Sales also included 27 semi-detached homes (down 18.2 per cent) and 22 freehold townhouses (up 10 per cent).
View Full Media Release
Tags: buyers, Kitchener Sellers, kitchener-waterloo real estate, KW Awesome, KW Market Update, KW Real Estate, KW Realtor, kwar, sellers, Top Realtor, Waterloo Sellers
Posted in Kitchener Buyers, Kitchener Sellers, Market Stats, Market Update, News From the City, Real Estate News, Waterloo Buyers, Waterloo Sellers | Comments Off on JANUARY HOME SALES SNOWED UNDER BY LOW INVENTORY
Friday, January 11th, 2013
With an uncertain housing market, more homeowners are opting to put their houses on the market in January. Here are some tips for buyers and sellers to negotiate a safe and successful winter home sale!
By Mark Weisleder | Fri Jan 11 2013| moneyville.ca
January is a slow month for real estate as most sellers choose to wait until the middle of February in the hopes of capitalizing on the early spring market. However, given the uncertainty in the housing market right now, more sellers are opting to put their house on the market in January.
This presents an opportunity for buyers. Most people are reluctant to uproot their families during the school year, so that means less competition — and fewer bidding wars. Lenders will not be as busy, so buyers can expect a more efficient process to get approved for a mortgage to ensure they have financing in place before making an offer.
But there are things you simply won’t be able to inspect during the winter. Here are some tips for protecting yourself when making a deal during the winter months:
Sellers
Spruce up the outside: Use urns with light wood branches to brighten up the exterior of your home, to compensate for any overcast day or snow on the ground.
Get rid of the Christmas lights: homes that look dated on the outside give the impression that they are probably dated on the inside.
Make sure your fireplace is working during any showing, that the temperature is comfortable in the home and that any interior lighting compensates for what is usually grey lighting from outside.
Have pictures of your landscaping available from the summer and autumn, showing how beautiful your home looks year round.
Have available any inspections that you may have done on your air-conditioning unit or swimming pool before they were closed for the winter, as buyers will likely not be able to conduct inspections on these items and will have questions.
Consider inviting a company to do an environmental audit on your home in advance, confirming that there is no moisture behind the walls that could lead to mould and that you have sufficient insulation behind the walls.
Buyers
If there is anything that cannot be inspected because of the winter, such as the air-conditioning system or any swimming pool, then negotiate an extended warranty in the agreement, to give you until at least May 1, to inspect and have the seller be responsible for any damages. In addition, also negotiate a holdback of, say, $2,000 so that if a problem arises, the money comes out of that fund to fix it and you don’t have to chase the seller in court later.
Be careful about snow accumulating around the base of the home. It will be difficult for a home inspector to figure out whether the grading is likely to cause water problems in the basement later. Consider doing your own environmental audit to check for moisture behind any walls.
If the snow on the roof looks like it is evaporating faster than the snow around the house, it is likely a sign that there is not enough insulation in the home.
Check with your insurance company early as to whether you will have any difficulty obtaining insurance on the home; for example, by finding out whether there have been claims made in the neighbourhood about water damages or sewage backups.
Check whether snow accumulation makes it more difficult for street parking, as this may be the only parking available on certain streets. Also see how bad weather may affect your morning commute.
Check the last electric/gas bills, to determine how energy efficient the home is in winter.
People tend to hibernate and stay at home in the winter, so take the opportunity to get to know the neighbours before you finalize your purchase.
By being properly prepared in advance, buyers and sellers can negotiate a safe and successful winter home sale.
Read more stories from Mark Weisleder: click here.
Mark Weisleder is a Toronto real estate lawyer. Contact him at mark@markweisleder.com
{Source}
Tags: buyers, home, homeowners, house, january, listing, real estate, sale, sellers, tips, winter
Posted in Magazine Articles | Comments Off on Why more home sellers are listing in January


