Kitchener Waterloo Market Snapshot April 2025
Tuesday, May 6th, 2025April’s Market Signals Shifting Dynamics in Waterloo Region Real Estate
WATERLOO REGION, ON (May 5, 2025) —In April, a total of 595 homes were sold in the Waterloo Region via the Multiple Listing Service® (MLS®) System of the Cornerstone Association of REALTORS® (Cornerstone). This represents a 14.1 per cent decrease compared to the same period last year and a decline of 26.7 per cent compared to the average number of homes sold in the previous ten years for the same month.
“Home sales in April showed typical seasonal improvement over March, but remained notably below the ten-year average,” says Christal Moura, spokesperson for the Waterloo Region market. “What we’re seeing is a clear market rebalancing, with inventory levels up 75% above the ten-year average and nearly four months of supply across all property types. This shift is creating more opportunities for buyers who now have more time for due diligence and negotiations, while sellers are adapting to a market that demands strategic pricing and patience. Waterloo Region’s strong economic fundamentals continue to support overall market stability, even as we move away from the intense seller’s market of recent years.”
If you are considering to SELL your home or BUY a home in the next short while,
it would be highly beneficial for you to connect with one of our Team Agents at
The Riz Team
Do you want to know what your home is worth today? Click Below for our Online No Obligation Market Evaluation:
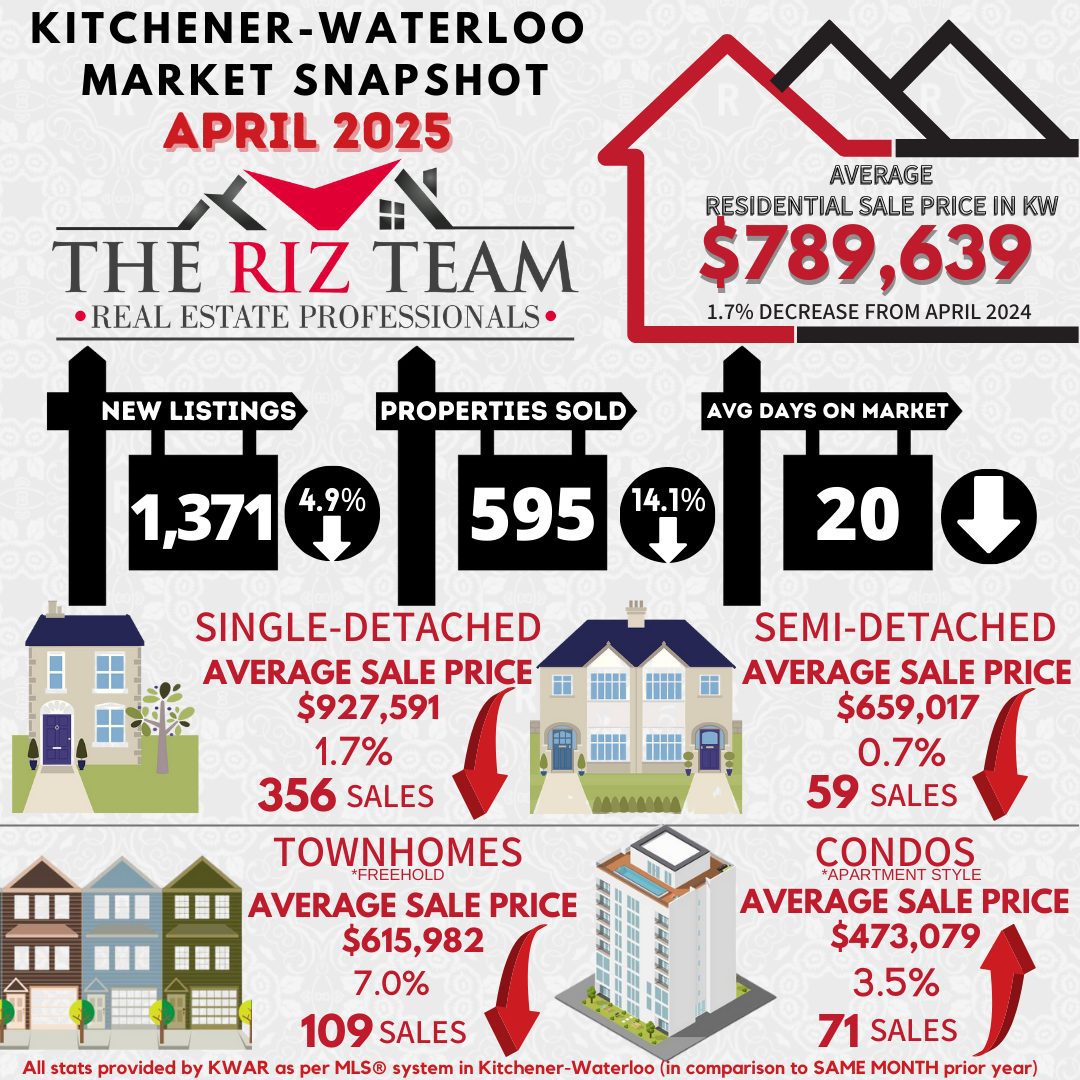
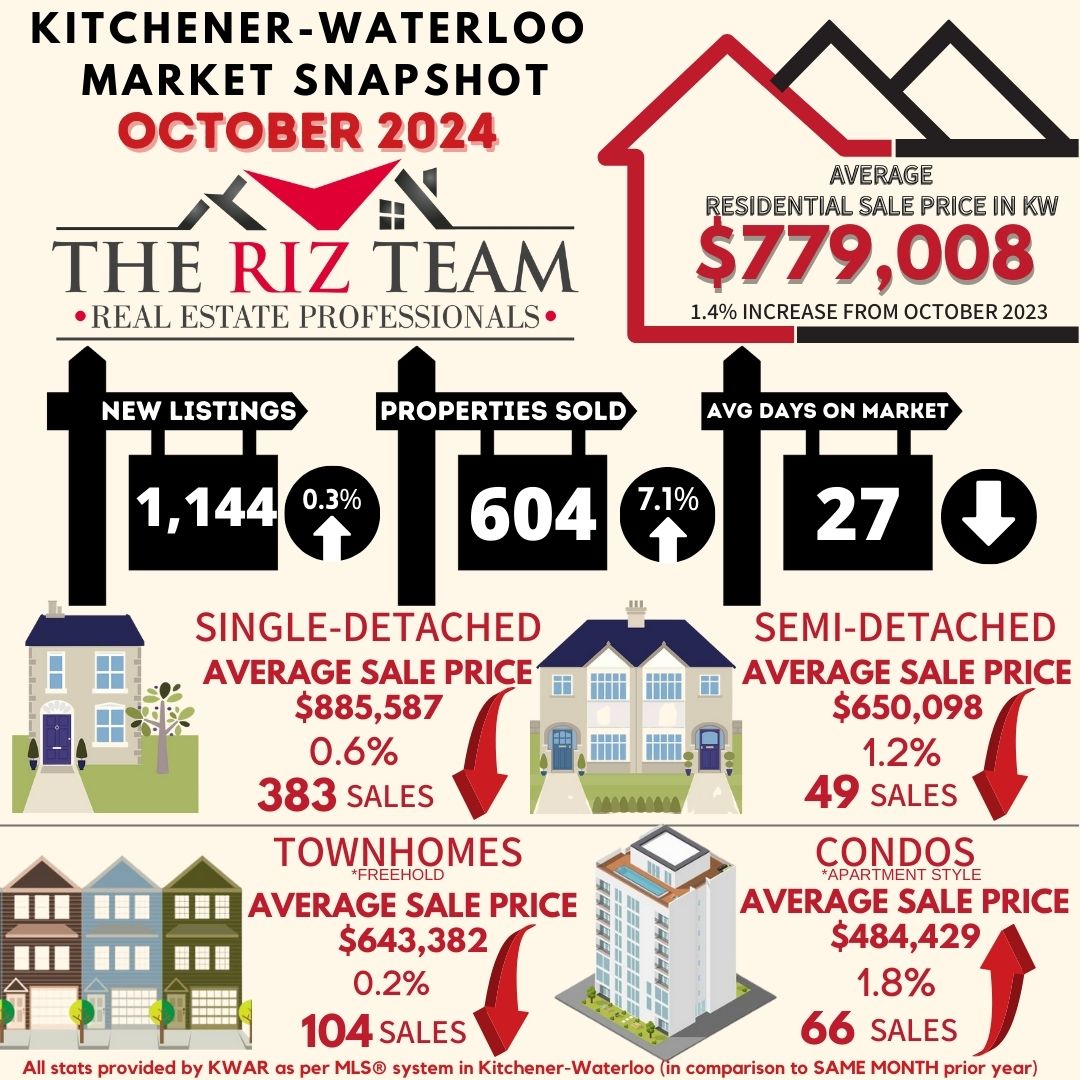
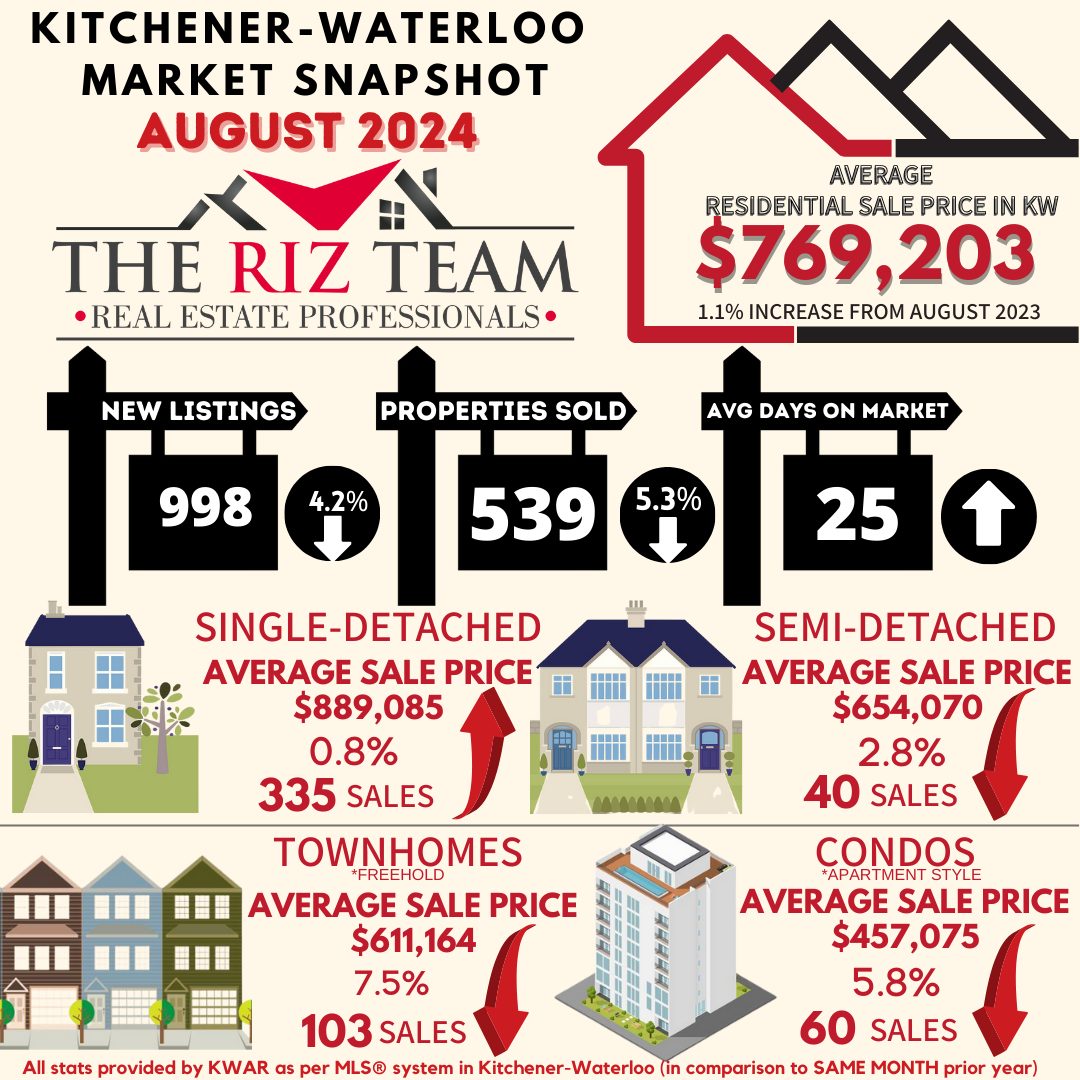
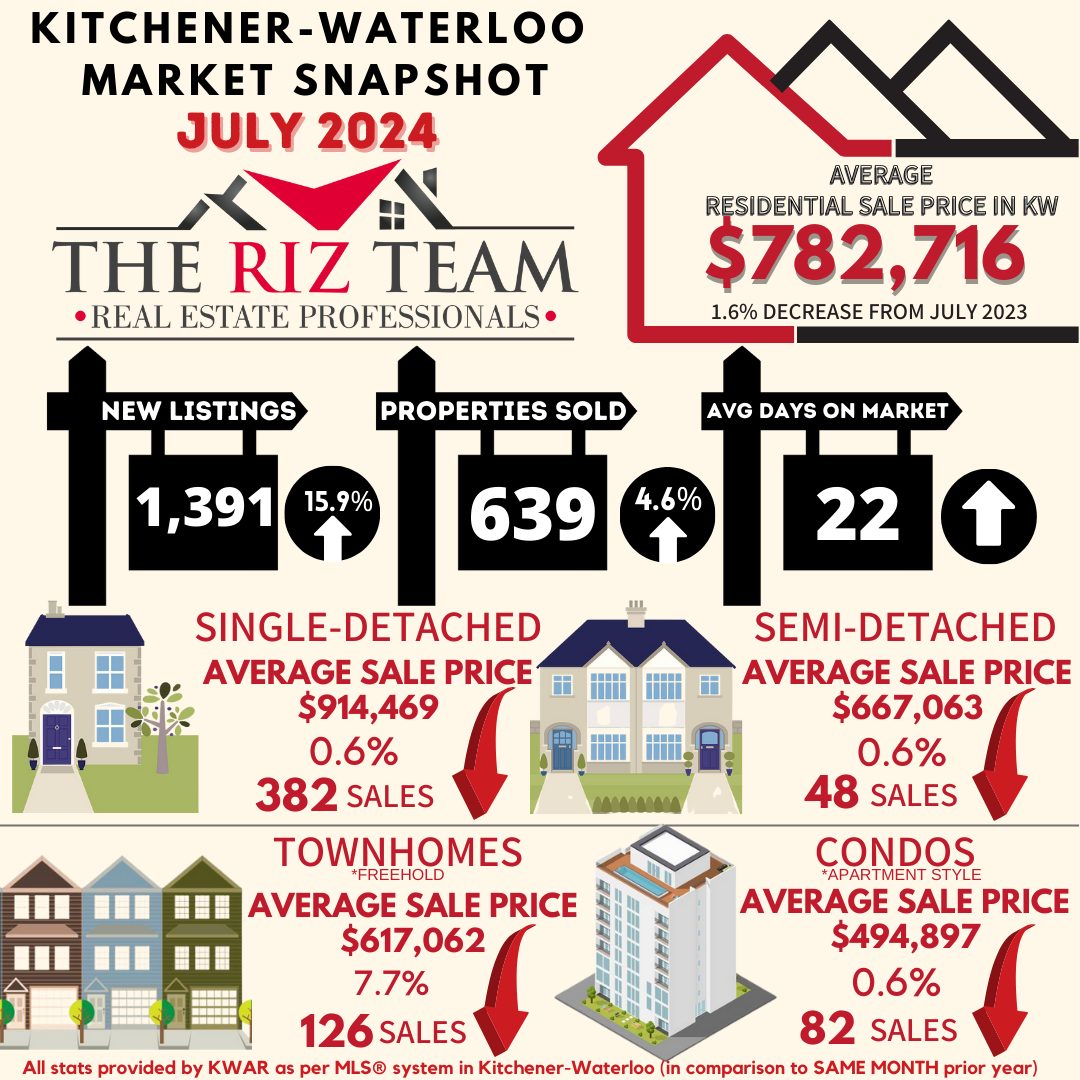
Total residential sales in April included 356 detached homes (down 12.5 per cent from April 2024), and 109 townhouses (down 19.9 per cent). Sales also included 71 condominium units (down 22.8 per cent) and 59 semi-detached homes (up 5.4 per cent).
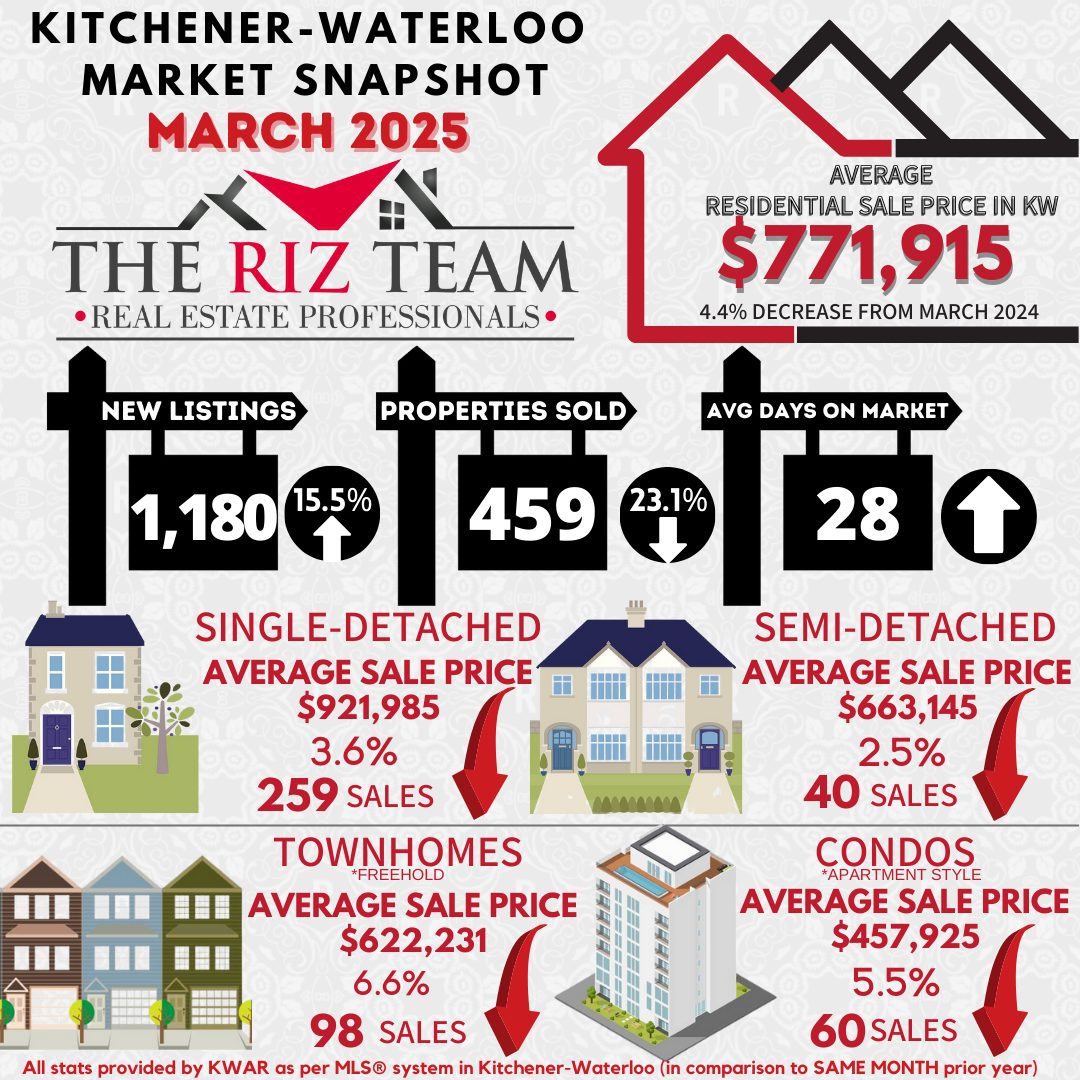
In April, the average sale price for all residential properties in Waterloo Region was $789,639. This represents a 1.7 per cent decrease compared to April 2024 and a 2.7 per cent increase compared to March 2025.
- The average price of a detached home was $927,591.?This represents a 1.7 per cent decrease from April 2024 and an increase of 0.9 per cent compared to March 2025.
- The average sale price for a townhouse was $615,982. This represents a 7.0 per cent decrease from April 2024 and a decrease of 0.2 per cent compared to March 2025.
- The average sale price for an apartment-style condominium was $473,079.?This is on par with April 2024 and an increase of 3.5 per cent compared to March 2025.
- The average sale price for a semi was $659,017. This represents a decrease of 0.7 per cent compared to April 2024 and a decrease of 0.6 per cent compared to March 2025.
Average Sale Price – Monthly

CORNERSTONE cautions that average sale price information can help establish long-term trends but does not indicate specific properties have increased or decreased in value. The MLS® Home Price Index (HPI) provides the best way to gauge price trends because averages are strongly distorted by changes in the mix of sales activity from one month to the next.
|
MLS® Home Price Index Benchmark Price (HPI) |
||||||
| Kitchener-Waterloo | Cambridge | |||||
| Benchmark Type: | April 2025 | Monthly % Change | Yr./Yr. % Change | April 2025 | Monthly % Change | Yr./Yr. % Change |
| Composite | $703,500 | -3.5 | -6.1 | $730,400 | -1.4 | -3.4 |
| Single Family | $821,100 | -2.6 | -5.2 | $773,600 | -0.8 | -2.1 |
| Townhouse | $582,300 | -2.7 | -7.1 | $626,800 | -0.6 | -4.7 |
| Apartment | $441,200 | 1.6 | -3.2 | $471,800 | -2.3 | -6.4 |

There were 1,371 new listings added to the MLS® System in Waterloo Region last month, a decrease of 4.9 per cent compared to April last year and a 10.5 per cent increase compared to the previous ten-year average for April.
The total number of homes available for sale in active status at the end of April was 1,936, an increase of 39.5 per cent compared to April of last year and 75.3 per cent above the previous ten-year average of 1,105 listings for April.
The total inventory across the market increased by 52.0 percent, resulting in a 3.8-month supply of all property types by the end of April. Condominium apartments had the highest inventory, with 8.0 months’ supply, followed by townhouses with 4.9 months’ supply and detached homes with 2.89 months’ supply. The number of months of inventory represents the time it would take to sell all current inventories at the current sales rate.
The average time to sell a home in April was 20 days, compared to 24 days in the previous month. In April 2024, it took 15 days for a home to sell, and the five-year average was 14 days.
“For those concerned about current market conditions, it’s important to remember that Waterloo Region remains one of Ontario’s most dynamic economic hubs, supported by our diverse employment base in tech, manufacturing, education, and healthcare,” says Moura. “My advice is to work closely with a REALTOR® who understands these shifting dynamics, focus on your long-term housing needs, and remember that real estate has historically proven to be a sound long-term investment in our region.”
View our HPI tool here to learn more: https://www.cornerstone.inc/stats/
Average Sales Price – Municipality

Average Sales Price – Township

Monthly Sales By Property Type

Monthly Supply of Homes for Sale

Monthly Supply of Homes for Sale – By Property Type

Monthly Median Sales Price – By Property Type

Monthly Average Sales Price – By Property Type

Monthly Average Days on Market

Cornerstone Association of REALTORS® cautions that average sale price information can help identify long-term trends but should not be to indicate that specific properties have increased or decreased in value. The average sale price is calculated based on the total dollar volume of all properties sold. Months Supply is the inventory of homes for sale at the end of a given month, divided by the average monthly closed sales from the last 12 months. Those requiring specific information on property values should contact a Waterloo Region REALTOR®. REALTORS® have their fingers on the pulse of the market. They know the questions to ask, the areas to probe and what to look for so that you get a complete picture of the property and community you’re considering.
Media Contact: Tania Benninger, COO, 519-576-1400
ABOUT CORNERSTONE
Cornerstone was formed on July 1, 2024, to better serve and represent REALTORS® in the markets of Mississauga, Burlington, Hamilton, Waterloo Region, Niagara North, Haldimand County, Norfolk County, and surrounding areas. With over 8,000 members, Cornerstone is Ontario’s second-largest REALTOR® association. Our mission is to lead with purpose, advocate boldly and create positive change for the success of our members. Cornerstone’s vision is to redefine the future of real estate through innovation and collaboration.
More information at www.cornerstone.inc
The trademarks REALTOR®, REALTORS®, and the REALTOR® logo are controlled by The Canadian Real Estate Association (CREA) and identify real estate professionals who are members of CREA.
The trademarks MLS®, Multiple Listing Service® and the associated logos are owned by The Canadian Real Estate Association (CREA) and identify the quality of services provided by real estate professionals who are members of CREA. Used under license.