Kitchener Market Snapshot March 2021
Tuesday, April 6th, 2021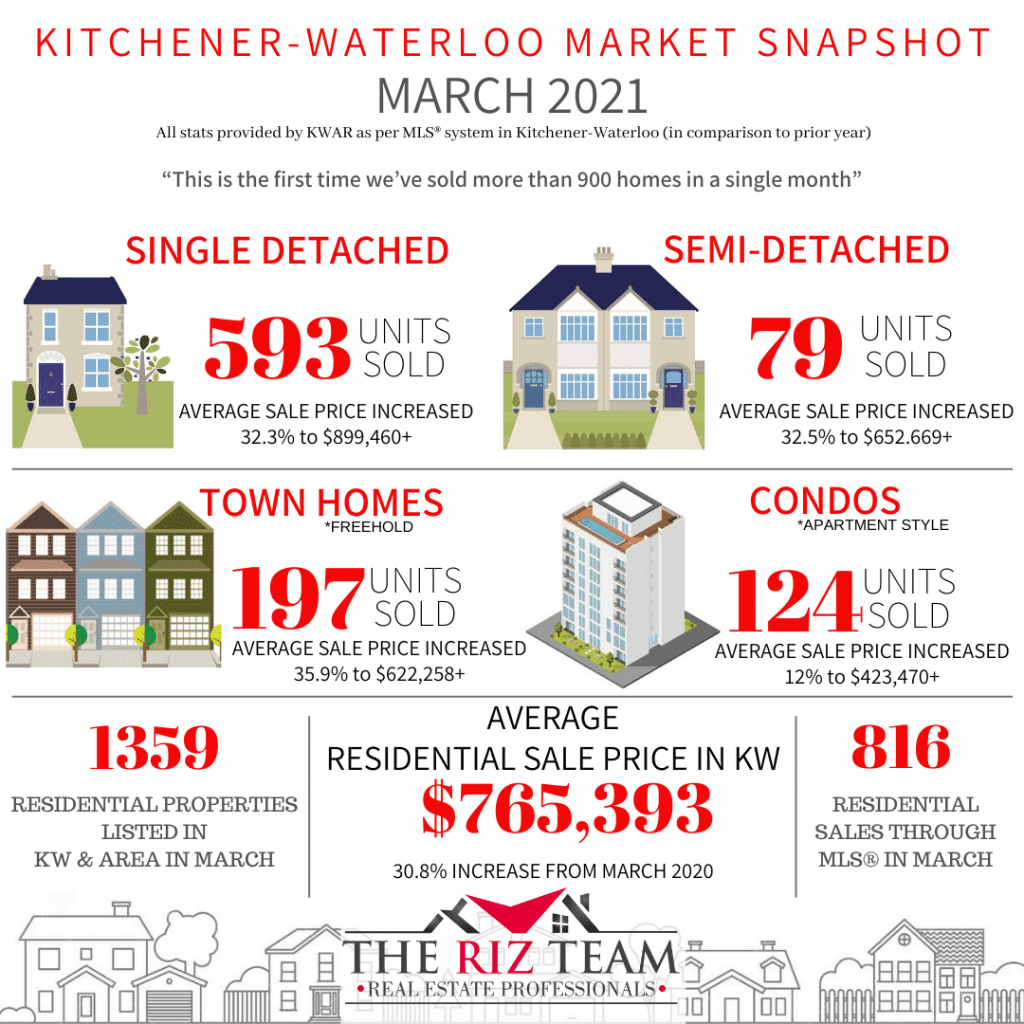
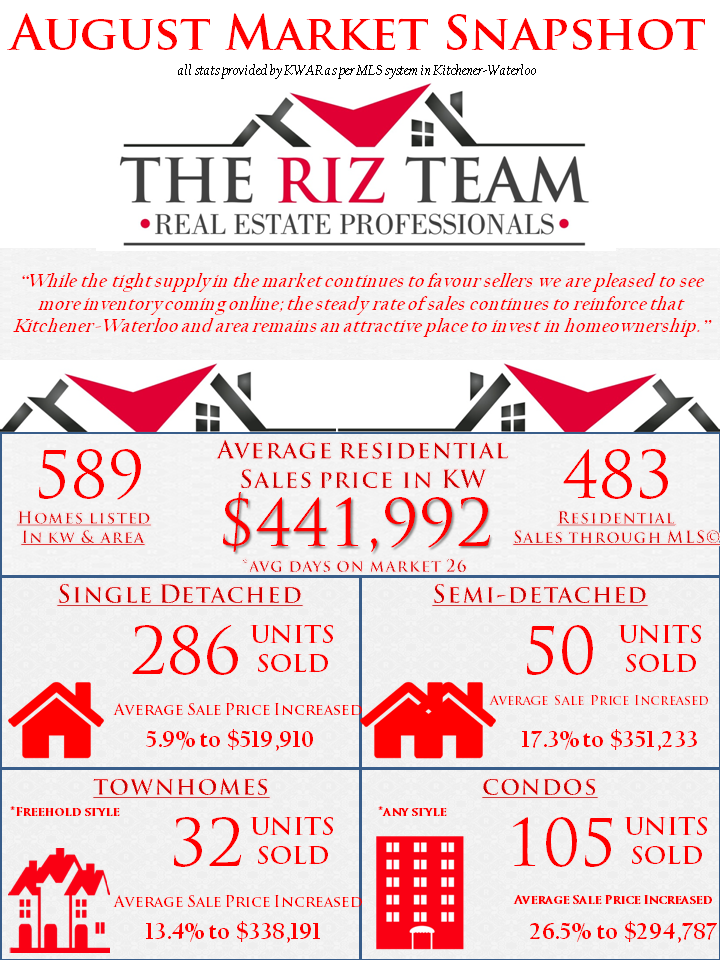
RECORD SMASHING NUMBER OF HOME SALES IN MARCH
KITCHENER-WATERLOO, ON (April 6, 2021) –– In March, the Kitchener-Waterloo Association of REALTORS® (KWAR) posted the highest number of monthly home sales in the board’s history. There were 993 residential homes sold through the Multiple Listing Service® (MLS® System) of KWAR in March, an increase of 72.7 per cent compared to March 2020, and an increase of 66 per cent compared to the previous month. The previous 10-year average number of residential sales for March is 552.
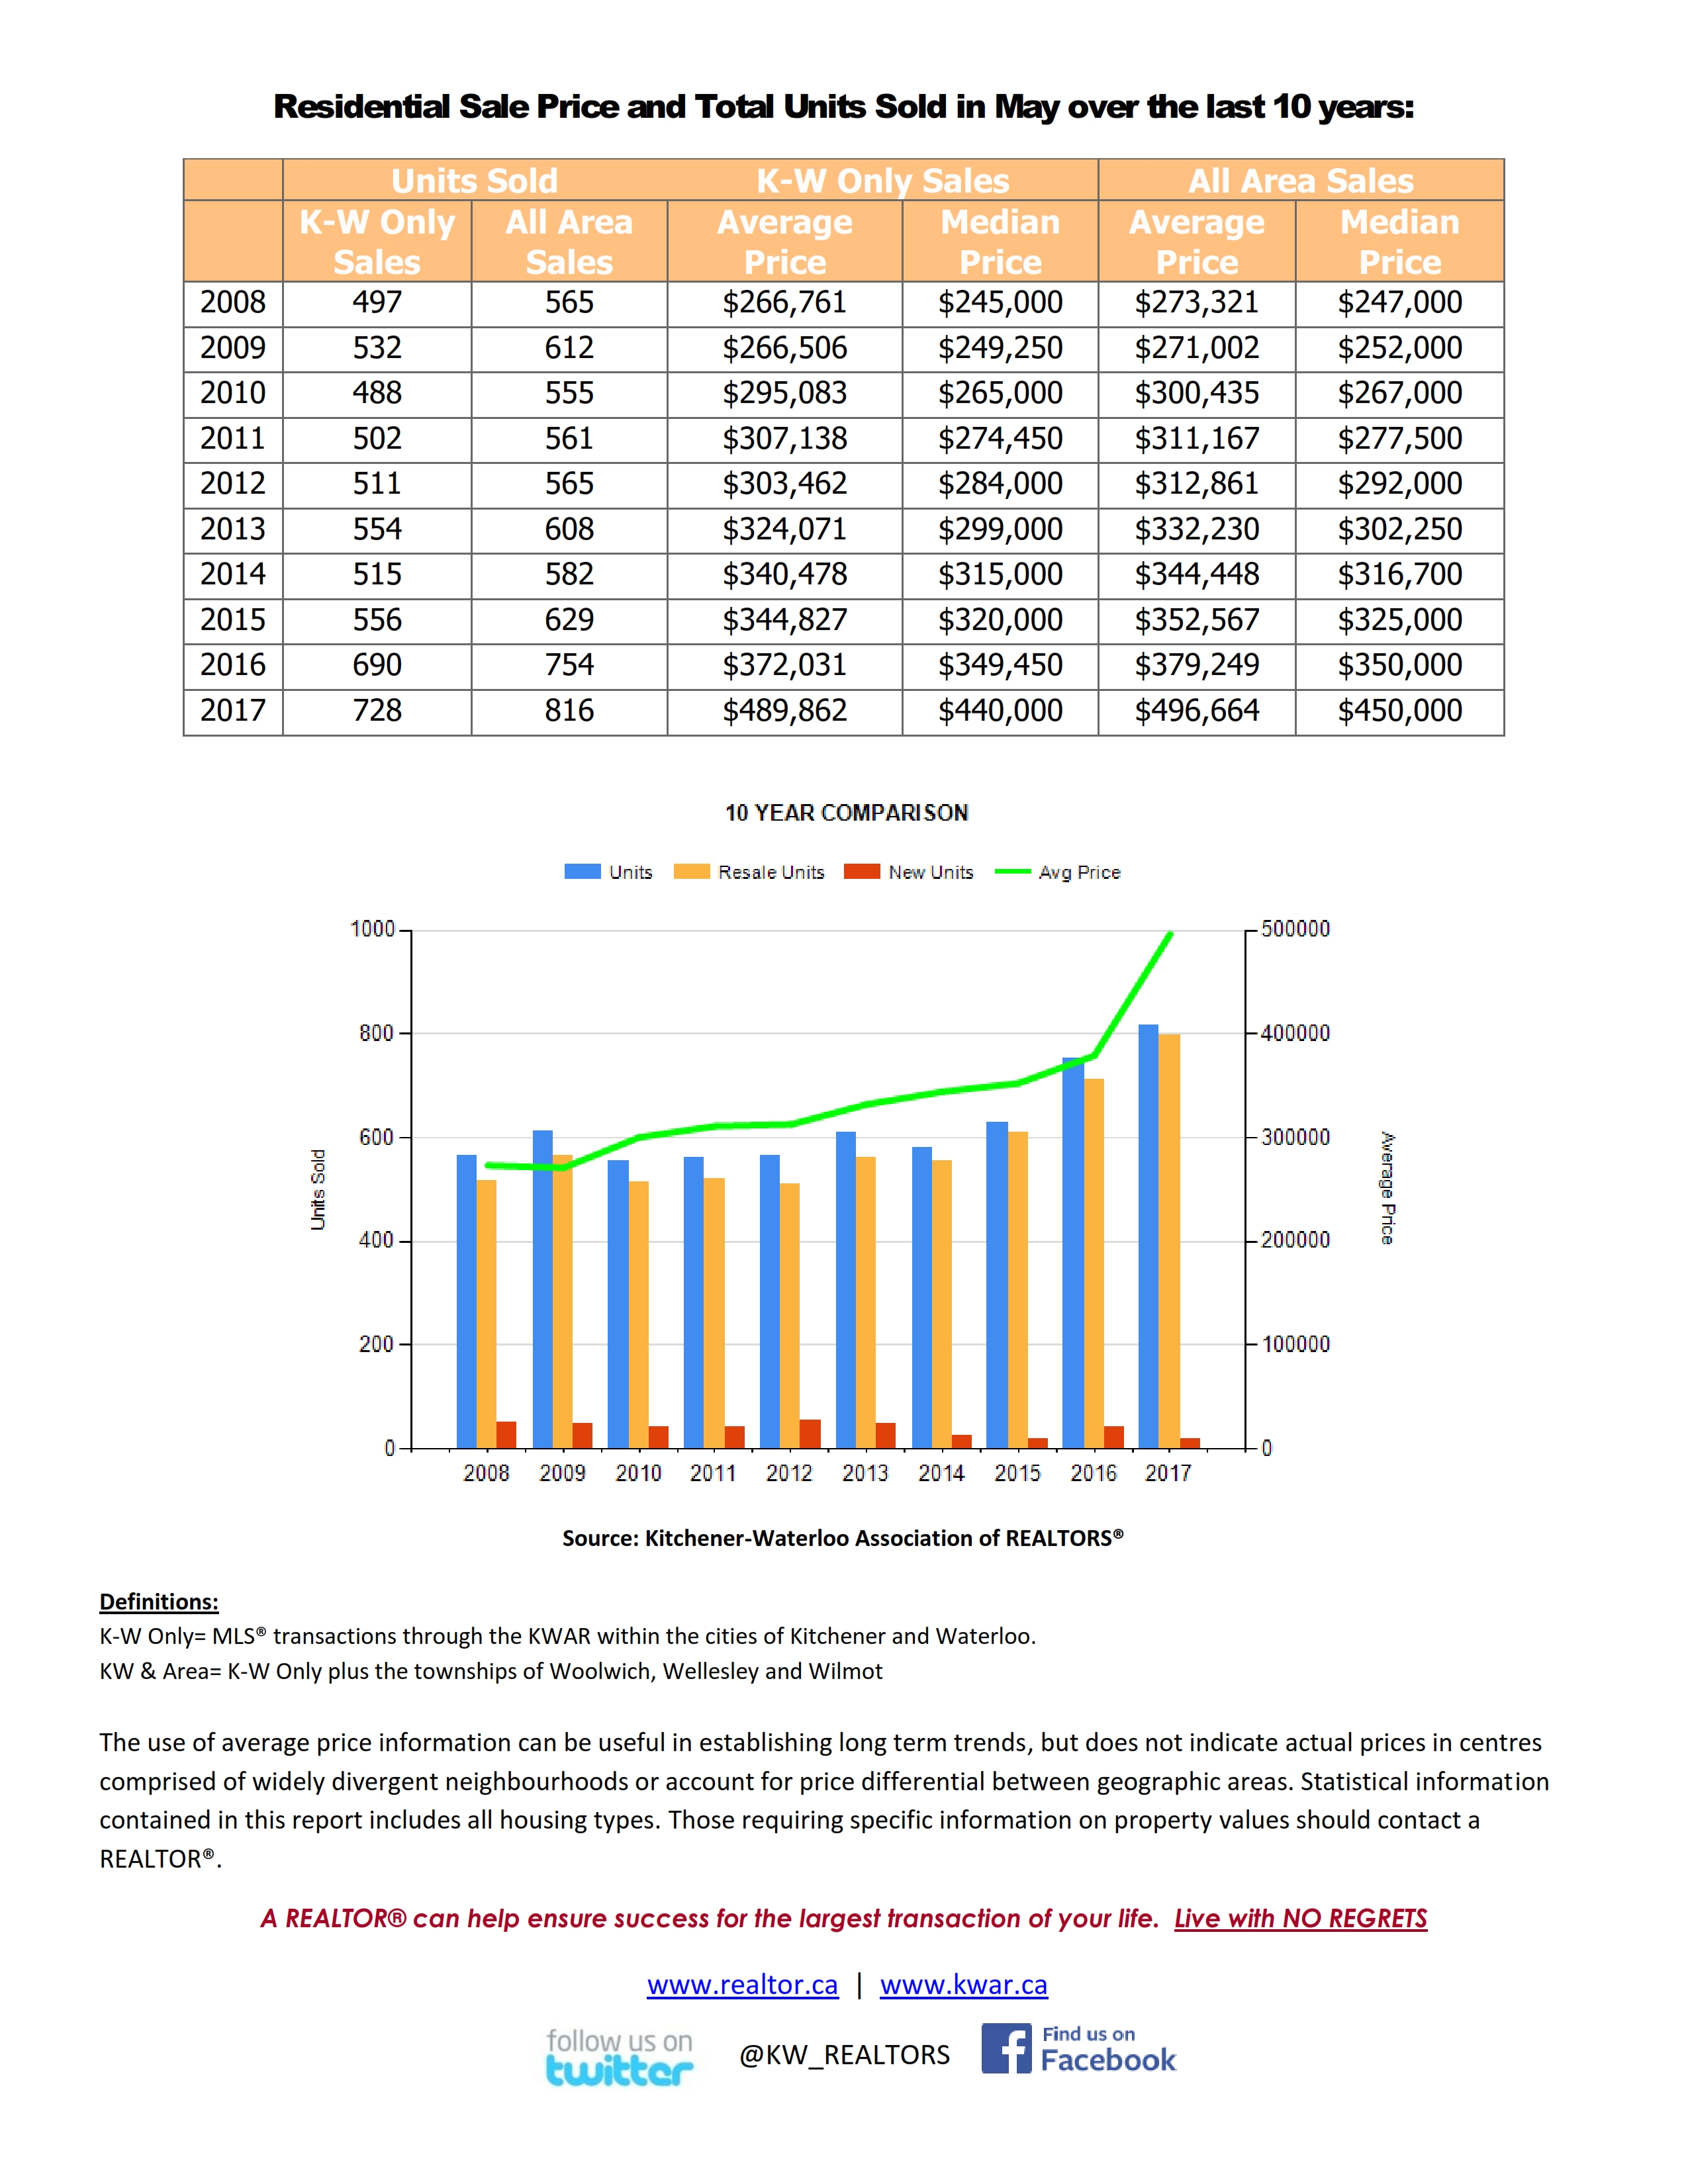
“This is the first time we’ve sold more than 900 homes in a single month,” says Nicole Pohl, President of KWAR. “The second highest number of sales occurred in May 2017 when there were 816 sales through our MLS® System.”
Total residential sales in March included 593 detached (up 69.4 per cent from March 2020), and 124 condominium units (up 82.4 per cent). Sales also included 79 semi-detached homes (up 216 per cent) and 197 townhouses (up 49.2 per cent).
In March, the average sale price for all residential properties in the Kitchener-Waterloo area was $765,393. This represents a 30.8 per cent increase over March 2020, and a 1.5 per cent increase compared to February 2021.
-
-
- The average price of a detached home was $899,460. This represents a 32.3 per cent increase from March 2020, and a decrease of 1.4 per cent compared to February 2021.
-
-
-
- The average sale price for an apartment-style condominium was $423,470. This represents an increase of 12 per cent from March 2020, and an increase of 1.6 per cent compared to February 2021.
-
-
-
- The average sale price for a townhouse was $622,258. This represents a 35.9 per cent increase from March 2020, and an increase of 2 per cent compared to February 2021.
-
-
-
- The average sale price for a semi was $652,669. This represents an increase of 32.5 per cent compared to March 2020, and a decrease of 4.8 per cent compared to February 2021.
-
“On a year-over-year basis we continued to see huge price increases in the average price in March, however compared to February we are seeing some signs that perhaps prices may be starting to stabilize a bit,” says Pohl.
KWAR cautions that average sale price information can be useful in establishing long term trends but should not be used as an indicator that specific properties have increased or decreased in value. The MLS® Home Price Index (HPI) provides the best way to gauge price trends because averages are strongly distorted by changes in the mix of sales activity from one month to the next.
The MLS® HPI composite benchmark price for all residential properties in Kitchener-Waterloo was $738,200 in March. This represents a 33.4 per cent increase over March 2020 and a 4 per cent increase compared to February 2021.
-
-
- The benchmark price for a detached home was $817,000. This represents a 34.4 per cent increase from March 2020 and 3.6 per cent increase compared to February 2021.
-
-
-
- The benchmark price for an apartment-style condominium was $358,700. This represents a 14.9 per cent increase from March 2020 and a 5.1 per cent increase compared to February 2021.
-
-
-
- The benchmark price for a townhouse is $554,900. This represents a 38.3 per cent increase from March 2020 and a 5.4 per cent increase compared to February 2021.
-
“In addition to the record number of sales in March, we also had a record number of newly listed properties come on the market,” says Pohl. “The number of new listings last month was the most of any month, and the highest number since May of 2017 when there were 1,271 new listings.”
There were 1,359 new listings added to the MLS® System in KW and area last month, an increase of 56.2 per cent compared to March of last year, and a 63.9 per cent increase compared to the previous ten-year average for March.
Pohl notes while the additional inventory is welcome, home buying demand continues to substantially outpace supply.
The total number of homes available for sale in active status at the end of March was 434, a decrease of 23.5 per cent compared to March of last year, and 63.5 per cent below the previous ten-year average of 1,188 listings for March.
The number of months of inventory was 0.7 in March and has numbered less than 1 month since October. The number of months of inventory represents how long it would take to sell off current inventories at the current rate of sales.
The average number of days to sell in March was 8 days, compared to 16 days in March 2020 and a previous 5-year average of 21 days.
Those requiring specific information on property values should contact a local REALTOR®. Working with a Realtor is the best way to get a complete picture of the property and community you are considering.
View our HPI tool here to learn more: https://kwar.ca/hpi-dashboard
Historical Sales By Property Type

Months Supply of Homes for Sale

Historical Median Sales Price – By Property Type

Historical Average Sales Price – By Property Type


KWAR cautions that average sale price information can be useful in establishing long term trends but should not be used as an indicator that specific properties have increased or decreased in value. The average sale price is calculated based on the total dollar volume of all properties sold. Months Supply is the inventory of homes for sale at the end of a given month, divided by the average monthly closed sales from the last 12 months Those requiring specific information on property values should contact a local REALTOR®. REALTORS® have their fingers on the pulse of the market. They know the questions to ask, the areas to probe and what to look for so that you get a complete picture of the property and community you’re considering.


 Giving a Smaller Home a More Roomy Feel