Kitchener Market Snapshot for October 2020
Wednesday, November 4th, 2020
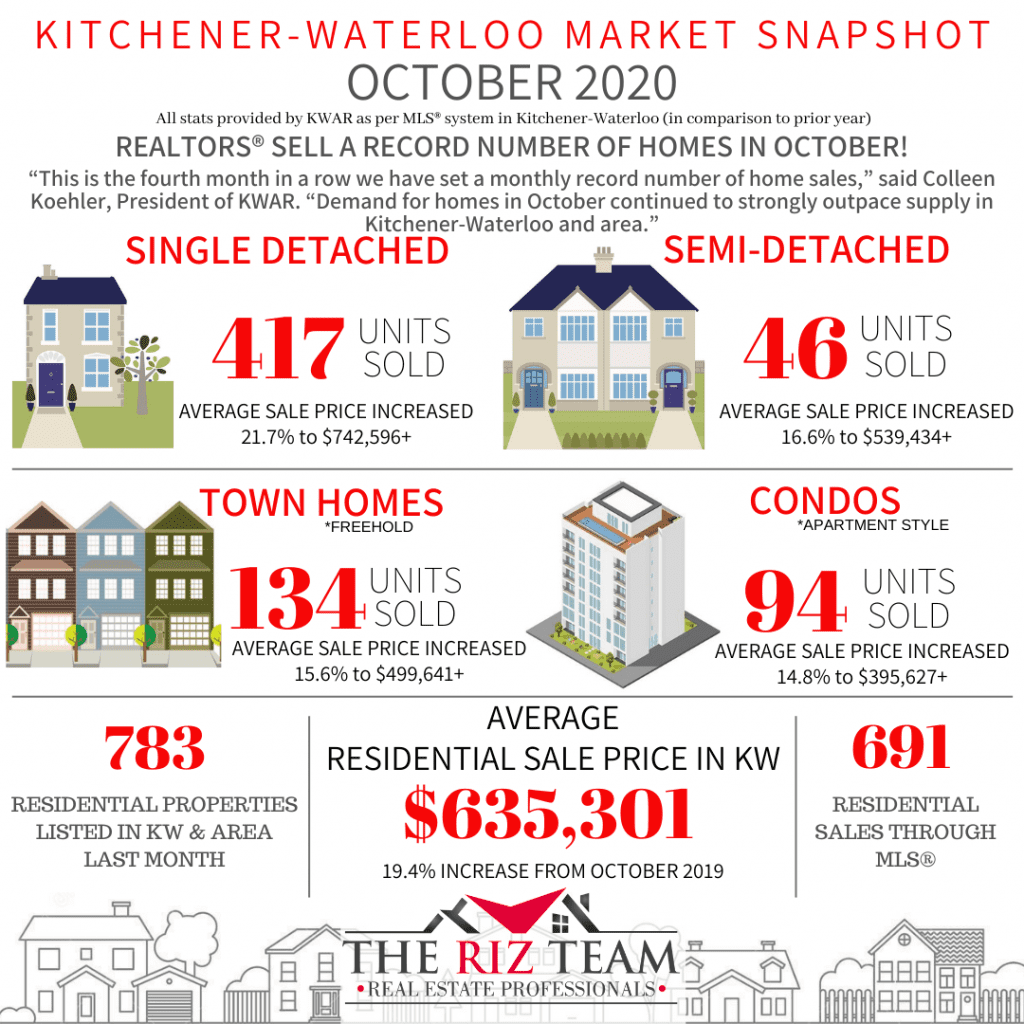
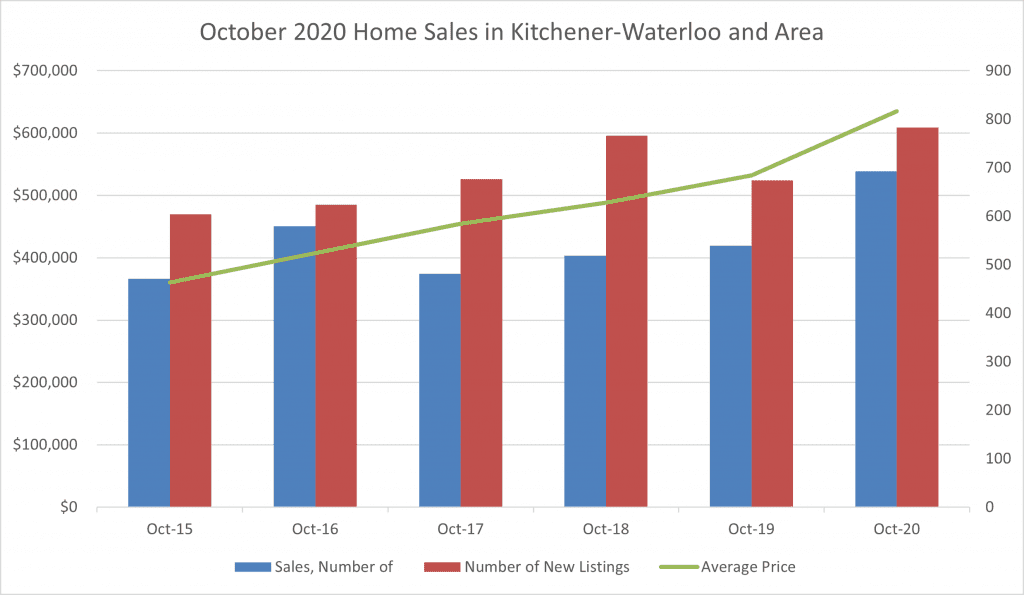
KITCHENER-WATERLOO, ON (November 4, 2020) ––There were 691 residential homes sold through the Multiple Listing System (MLS® System) of the Kitchener-Waterloo Association of REALTORS® in October, the most ever recorded for the month. October’s home sales represented an increase of 28 per cent compared to the same month last year, and a decrease of 9.6 per cent compared to the previous month. The previous ten-year average number of residential sales for October is 471.
“This is the fourth month in a row we have set a monthly record number of home sales,” said Colleen Koehler, President of KWAR. “Demand for homes in October continued to strongly outpace supply in Kitchener-Waterloo and area.”
Total residential sales in October included 417 detached homes (up 25.6 per cent from October 2019), and 94 condominium apartments (up 34 per cent). Sales also included 134 townhouses (up 26.4 per cent) and 46 semi-detached homes (up 48.3 per cent).
The average sale price of all residential properties sold in October increased 19.4 per cent to $635,301 compared to the same month last year, while detached homes sold for an average price of $742,596 an increase of 21.7 per cent. During this same period, the average sale price for an apartment-style condominium was $395,627 for an increase of 14.8 per cent. Townhomes and semis sold for an average of $499,641 (up 15.6 per cent) and $539,434 (up 16.6 per cent) respectively.
The median price of all residential properties sold in October increased 19.2 per cent to $595,000 and the median price of a detached home during the same period increased 20.5 per cent to $686,000.
“Consumers buying/selling real estate continues to be one of the few shining lights to help Ontario’s economy recover from the pandemic,” said Koehler. “We’re continuing to see more buyers than sellers, including additional buyers migrating here from out of the region looking for the quality of life this region offers.”
There were 783 new listings added to the MLS® System in KW and area last month, an increase of 16 per cent compared to October of last year, and 11.5 per cent more than the previous ten-year average for October.
The number of Months Supply (also known as absorption rate) continues to be very low at just 1 month for the month of October. The previous ten-year average supply of homes for October was 3.2 months, and in the past 5 years, the average supply for October was 1.8 months.
KWAR’s president says the market we have been experiencing is extraordinary. “While our association does not track where buyers are coming through the MLS® System, I can say unequivocally we are seeing strong demand from GTA buyers. What people want and need in a home, and where they want to be located has been redefined in a very short period. Waterloo region is quite rightly, a highly desirable place to own a home.”
The average days to sell in October was 13 days, compared to 23 days in October 2019.
KWAR cautions that average sale price information can be useful in establishing long term trends but should not be used as an indicator that specific properties have increased or decreased in value. The average sale price is calculated based on the total dollar volume of all properties sold. Months Supply is the inventory of homes for sale at the end of a given month, divided by the average monthly closed sales from the last 12 months Those requiring specific information on property values should contact a local REALTOR®. REALTORS® have their fingers on the pulse of the market. They know the questions to ask, the areas to probe and what to look for so that you get a complete picture of the property and community you are considering.

