Kitchener Market Snapshot for January 2020
Wednesday, February 5th, 2020Kitchener Market Snapshot January 2020

Fewer Home Sales in January as the Number of Homes for Sale Continues to Elude Buyers in Kitchener- Waterloo
“For the third consecutive month sales were down in January,” says Colleen Koehler, President of KWAR. “Slower January sales are a result of fewer homes being put up for sale. This is causing further price acceleration as we have enough willing and able home buyers contending for those few homes that are available.”
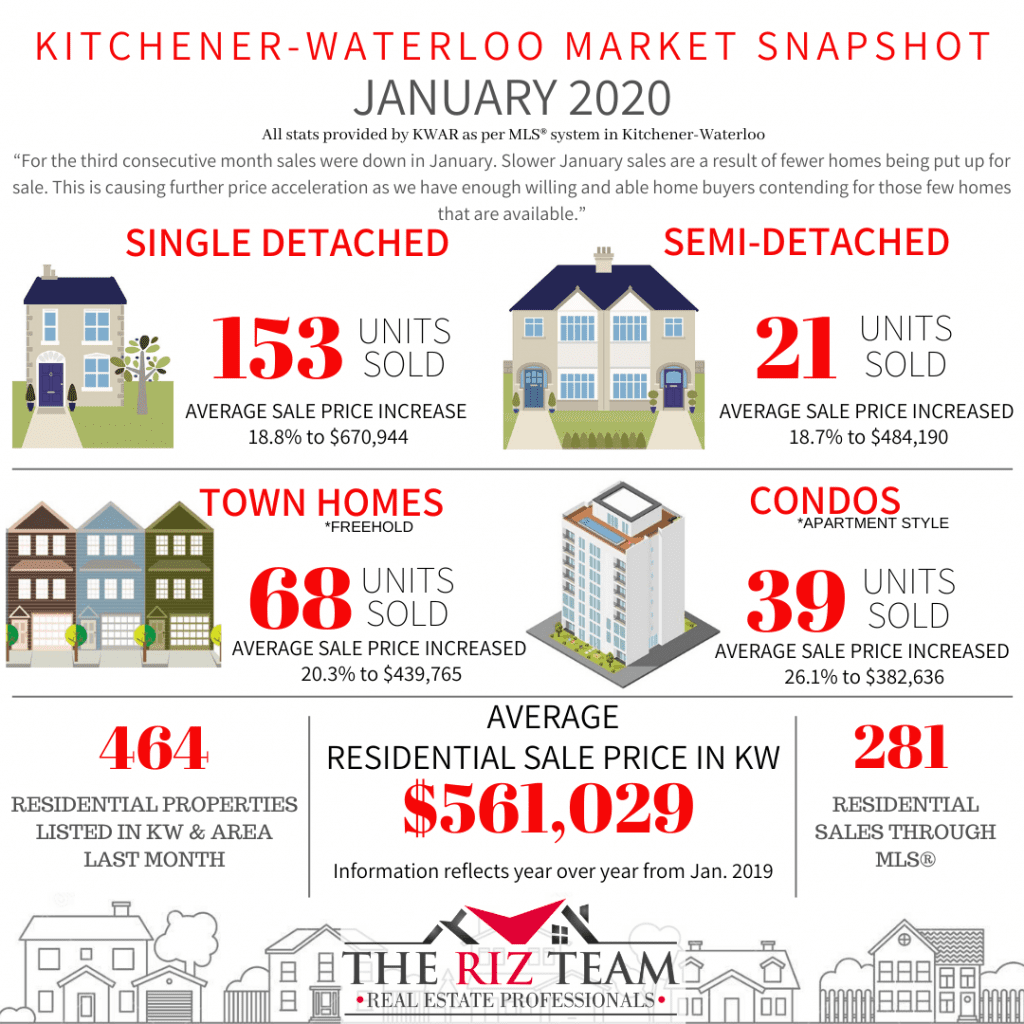
Total residential sales in January included 153 detached homes (down 19 per cent), and 39 condominium units (up 18.2 per cent) which includes any property regardless of style (i.e. semis, townhomes, apartment, detached etc.). Sales also included 21 semi-detached homes (on par) and 68 freehold townhouses (up 7.9 per cent).
The average sale price of all residential properties sold in January increased 15.7 per cent to $561,029 compared to the same month last year, while detached homes sold for an average price of $670,944 an increase of 18.8 per cent. During this same period, the average sale price for an apartment-style condominium was 382,636 for an increase of 26.1 per cent. Townhomes and semis sold for an average of $439,765 (up 20.3 per cent) and $484,190 (up 18.7 per cent) respectively.
The median price of all residential properties sold in January increased 17.3 per cent to $536,000 and the median price of a detached home during the same period increased 22.6 per cent to $650,000.
“Consumers can’t buy what’s not there. The available number of homes for sale, or lack thereof, continued to evade home buyers in January,” says Koehler. “There is no doubt we would be reporting more sales if we had the inventory to match the demand.”
Koehler notes Kitchener-Waterloo and area continues to be an exceptionally attractive place to buy a home and a creditworthy buyer can negotiate an attractive interest rate with their mortgage lender.
REALTORS® listed 464 residential properties in KW and area last month, a drop of 21.1 per cent compared to January of 2019, and a decrease of 35.4 per cent in comparison to the previous ten-year average for January. The total number of homes available for sale in active status at the end of January was 392, a decrease of 38.7 per cent compared to January of last year, and 63.7 per cent below the previous ten-year average of 1,080 listings for January. The number of Months Supply (also known as absorption rate) in January was just 0.8 months, 38.5 per cent below the same period last year. The previous ten-year average supply of homes for January was 2.32 months, however, in the past 5 years the average supply for January was 1.96 months.
The average days to sell in January was 22 days, compared to 27 days in January 2019.
Historical Sales By Property Type

Months Supply of Homes for Sale

Historical Average Sales Price – By Property Type

Historical Sales – By Price Range

