The Riz Team Blog

Posts Tagged ‘Kitchener Buyers’

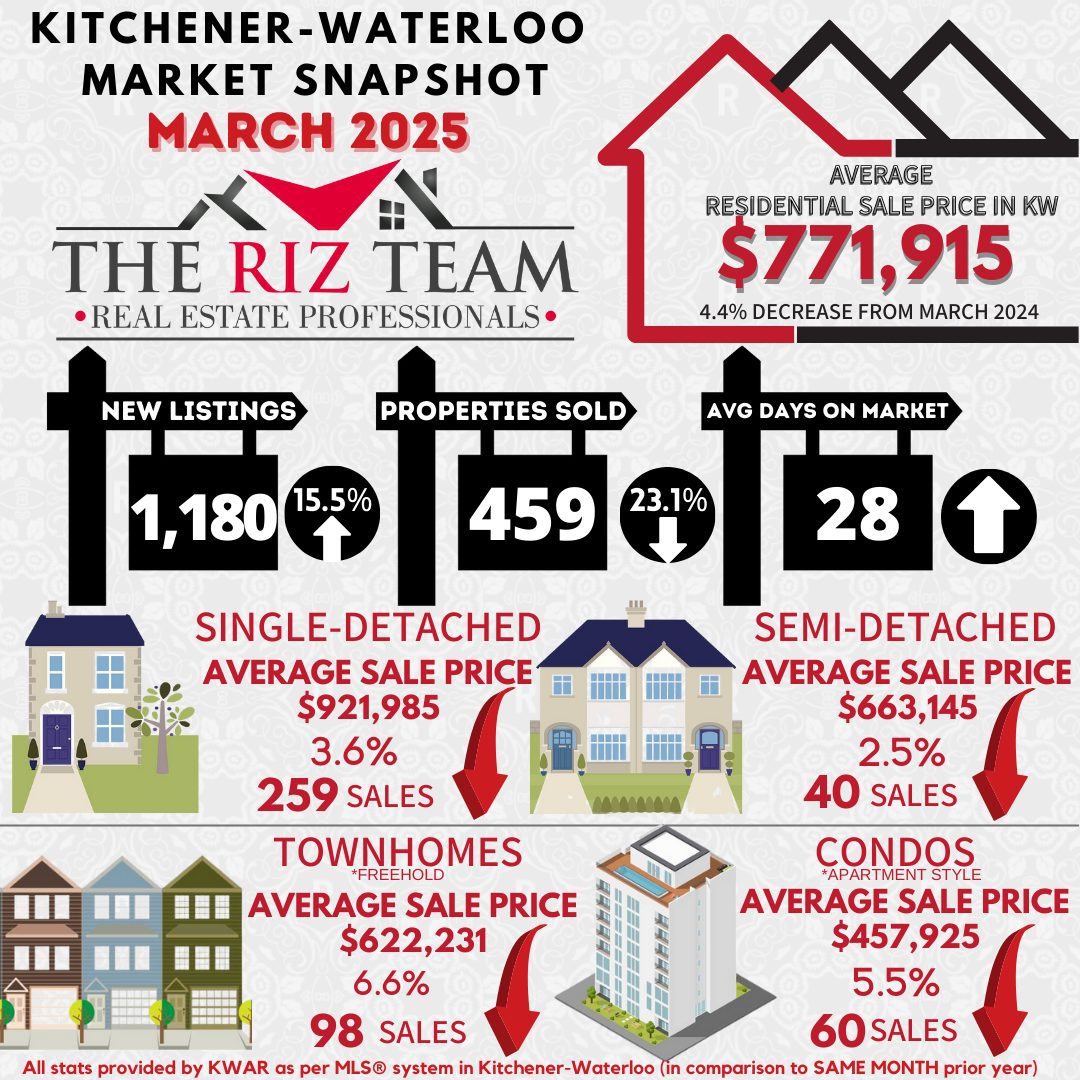
Kitchener Waterloo Market Snapshot March 2025

Wednesday, April 2nd, 2025

Waterloo Region Home Sales Cool in March as Inventory Reaches Nine-Year High

WATERLOO REGION, ON (April 2, 2025) —In March, a total of 459 homes were sold in the Waterloo Region via the Multiple Listing Service® (MLS®) System of the Cornerstone Association of REALTORS® (Cornerstone). This represents a 23.1 per cent decrease compared to the same period last year and a decline of 45.2 per cent compared to the average number of homes sold in the previous ten years for the same month. 

“March’s housing market shows a significant shift from last year’s dynamics, with sales activity cooling while inventory levels have reached their highest point for March since 2015,” notes Christal Moura, spokesperson for the Waterloo Region market. “This changing landscape is providing buyers with more options and time to make informed decisions.” 

If you are considering to SELL your home or BUY a home in the next short while, 

it would be highly beneficial for you to connect with one of our Team Agents at

The Riz Team

Do you want to know what your home is worth today? Click Below for our Online No Obligation Market Evaluation:Click Here


Total residential sales in March included 259 detached homes (down 24.7 per cent from March 2024), and 98 townhouses (down 24.0 per cent). Sales also included 60 condominium units (down 29.4 per cent) and 40 semi-detached homes (up 8.1 per cent).  

In March, the average sale price for all residential properties in Waterloo Region was $771,915. This represents a 4.4 per cent decrease compared to March 2024 and a 0.5 per cent increase compared to February 2025.  

  • The average price of a detached home was $921,985. This represents a 3.6 per cent decrease from March 2024 and an increase of 2.3 per cent compared to February 2025.  
  • The average sale price for a townhouse was $622,231. This represents a 6.6 per cent decrease from March 2024 and an increase of 1.2 per cent compared to February 2025.  
  • The average sale price for an apartment-style condominium was $457,925. This represents a 5.5 per cent decrease from March 2024 and an increase of 4.8 per cent compared to February 2025.  
  • The average sale price for a semi was $663,145.  This represents a decrease of 2.5 per cent compared to March 2024 and a decrease of 1.1 per cent compared to February 2025. 

Average Sale Price – Monthly

CORNERSTONE cautions that average sale price information can help establish long-term trends but does not indicate specific properties have increased or decreased in value. The MLS® Home Price Index (HPI) provides the best way to gauge price trends because averages are strongly distorted by changes in the mix of sales activity from one month to the next.

MLS® Home Price Index Benchmark Price (HPI) 
  Kitchener-Waterloo  Cambridge 
Benchmark Type:  March 2025  Monthly % Change  Yr./Yr. % Change  March 2025  Monthly % Change  Yr./Yr. % Change 
Composite  $728,800  -0.2  -2.7  $740,900  -1.4  -1.9 
Single Family  $843,300  0.3  -2.5  $779,500  -1.6  -1.3 
Townhouse  $598,300  -0.3  -3.4  $630,600  0.2  -3.2 
Apartment  $434,200  -1.4  -6.7  $482,800  -0.3  -3.5 

“While both average prices and the HPI declined on a year-over-year basis, we’re seeing month-over-month price stability in most housing categories. The increased inventory, now at a 3.2-month supply, is creating a more balanced market environment compared to the tight conditions we’ve experienced in recent years,” said Moura. “This shift is particularly evident in the condominium segment, where we now have nearly seven months of inventory available.” 

There were 1,180 new listings added to the MLS® System in Waterloo Region last month, an increase of 15.5 per cent compared to March last year and a 2.4 per cent decrease compared to the previous ten-year average for March.  

The total number of homes available for sale in active status at the end of March was 1,700, an increase of 58.4 per cent compared to March of last year and 72.9 per cent above the previous ten-year average of 983 listings for March. 

The total inventory across the market increased by 68.4 percent, resulting in a 3.2-month supply of all property types by the end of March. Condominium apartments had the highest inventory, with 6.9 months’ supply, followed by townhouses with 4.2 months’ supply and detached homes with 2.3 months’ supply. The number of months of inventory represents the time it would take to sell all current inventories at the current sales rate. 

The average time to sell a home in March was 28 days, compared to 24 days in the previous month. In March 2024, it took 19 days for a home to sell, and the five-year average was 14 days. 

Cornerstone emphasizes the importance of consulting a local REALTOR® when considering buying or selling property in the Waterloo Region. Their expertise can provide valuable insights into the current market conditions, enabling individuals to make well-informed decisions aligned with their goals and preferences. 

Average Sales Price – Municipality

Average Sales Price – Township

Monthly Sales By Property Type

Monthly Supply of Homes for Sale

Monthly Supply of Homes for Sale – By Property Type

Monthly Median Sales Price – By Property Type

Monthly Average Sales Price – By Property Type

Monthly Average Days on Market

Cornerstone Association of REALTORS® cautions that average sale price information can help identify long-term trends but should not be to indicate that specific properties have increased or decreased in value. The average sale price is calculated based on the total dollar volume of all properties sold. Months Supply is the inventory of homes for sale at the end of a given month, divided by the average monthly closed sales from the last 12 months. Those requiring specific information on property values should contact a Waterloo Region REALTOR®. REALTORS® have their fingers on the pulse of the market. They know the questions to ask, the areas to probe and what to look for so that you get a complete picture of the property and community you’re considering.

ABOUT CORNERSTONE

Cornerstone was formed on July 1, 2024, to better serve and represent REALTORS® in the markets of Mississauga, Burlington, Hamilton, Waterloo Region, Niagara North, Haldimand County, Norfolk County, and surrounding areas. With over 8,000 members, Cornerstone is Ontario’s second-largest REALTOR® association. Our mission is to lead with purpose, advocate boldly and create positive change for the success of our members. Cornerstone’s vision is to redefine the future of real estate through innovation and collaboration. 

More information at www.cornerstone.inc 

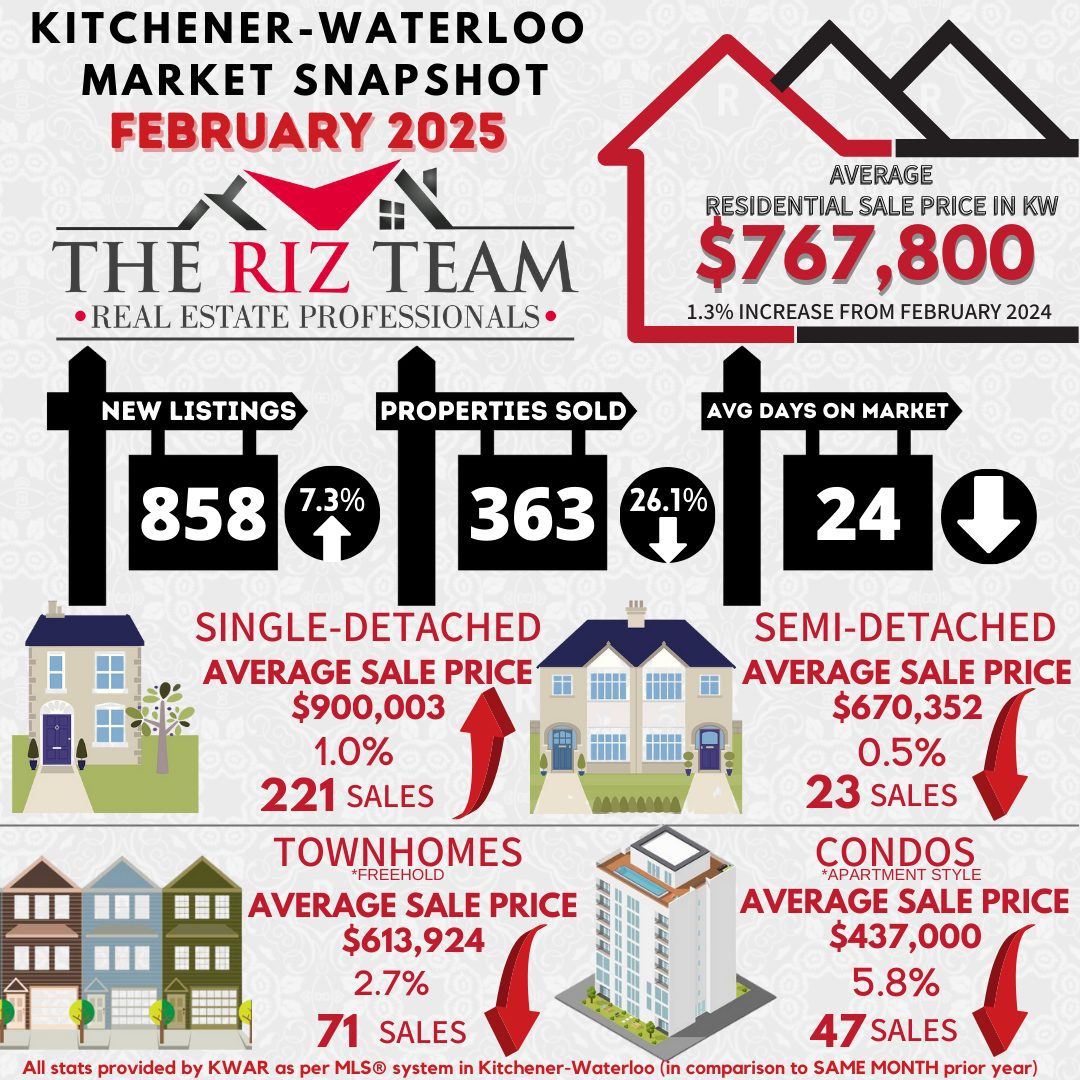
Kitchener Waterloo Market Snapshot February 2025

Wednesday, March 5th, 2025

New Listings Rise, While Home Sales Decline in Waterloo Region

WATERLOO REGION, ON (March 5, 2025) – In February, a total of 363 homes were sold in the Waterloo Region via the Multiple Listing Service® (MLS®) System of the Cornerstone Association of REALTORS® (Cornerstone). This represents a 26.1 per cent decrease compared to the same period last year and a decline of 38.8 per cent compared to the average number of homes sold in the previous ten years for the same month.

“While February’s home sales were affected by concerns over tariffs and their potential impact on employment, the market showed some encouraging signs. We saw a steady increase in new listings while prices remained stable,” notes Christal Moura, spokesperson for the Waterloo Region market. “The month’s significant snowfall created practical challenges for buyers and sellers, affecting property viewings and transactions. However, I am seeing positive indicators in the market, with consistent attendance at open houses, pre-listing appointments, steady mortgage pre-approvals, and buyers on the sidelines carefully watching for the right opportunity to make their move.”

If you are considering to SELL your home or BUY a home in the next short while, 

it would be highly beneficial for you to connect with one of our Team Agents at

The Riz Team

Do you want to know what your home is worth today? Click Below for our Online No Obligation Market Evaluation:Click Here

Total residential sales in February included 221 detached homes (down 21.9 per cent from February 2024), and 71 townhouses (down 36.0 per cent). Sales also included 47 condominium units (down 35.6 per cent) and 23 semi-detached homes (down 4.2 per cent).

In February, the average sale price for all residential properties in Waterloo Region was $767,800. This represents a 1.3 per cent increase compared to February 2024 and a 1.8 per cent increase compared to January 2025.

  • The average price of a detached home was $900,003. This represents a 1.0 per cent increase from February 2024 and an increase of 2.1 per cent compared to January 2025.
  • The average sale price for a townhouse was $613,924. This represents a 2.7 per cent decrease from February 2024 and a decrease of 2.6 per cent compared to January 2025.
  • The average sale price for an apartment-style condominium was $437,000. This represents a 5.8 per cent decrease from February 2024 and a decrease of 7.2 per cent compared to January 2025.
  • The average sale price for a semi was $670,352. This represents a decrease of 0.5 per cent compared to February 2024 and an increase of 6.6 per cent compared to January 2025.

Average Sale Price – Monthly

CORNERSTONE cautions that average sale price information can help establish long-term trends but does not indicate specific properties have increased or decreased in value. The MLS® Home Price Index (HPI) provides the best way to gauge price trends because averages are strongly distorted by changes in the mix of sales activity from one month to the next.

MLS® Home Price Index Benchmark Price

Kitchener-Waterloo Cambridge
Benchmark Type: February 2025 Monthly % Change Yr./Yr. % Change February 2025 Monthly % Change Yr./Yr. % Change
Composite $729,900 0.0 -0.9 $751,300 0.6 0.6
Single Family $841,000 -0.8 -1.1 $792,100 0.6 1.6
Townhouse $600,200 1.7 -1.8 $629,300 0.5 -2.1
Apartment $440,400 2.3 -1.9 $484,500 1.1 -2.2


“As we navigate these shifting dynamics in the Waterloo Region housing market, it’s important to remember that while sales may be down, the increase in inventory reflects growing opportunities for buyers,” said Moura.

There were 858 new listings added to the MLS® System in Waterloo Region last month, an increase of 7.3 per cent compared to February last year and a 0.8 per cent increase compared to the previous ten-year average for February.

The total number of homes available for sale in active status at the end of February was 1,450, an increase of 55.7 per cent compared to February of last year and 68.7 per cent above the previous ten-year average of 860 listings for February.

The total inventory across the market increased by 52.9 percent, resulting in a 2.6-month supply of all property types by the end of February. Condominium apartments had the highest inventory, with 5.9 months’ supply, followed by townhouses with 3.6 months’ supply and detached homes with 1.8 months’ supply. The number of months of inventory represents the time it would take to sell off current inventories at the current sales rate.

The average time to sell a home in February was 24 days, compared to 34 days in the previous month. Likewise, in February 2024, it took 24 days for a home to sell, and the five-year average was 15 days.

Cornerstone emphasizes the importance of consulting a local REALTOR® when considering buying or selling property in the Waterloo Region. Their expertise can provide valuable insights into the current market conditions, enabling individuals to make well-informed decisions aligned with their goals and preferences.

View our HPI tool here to learn more: https://www.cornerstone.inc/stats/

Average Sales Price – Municipality

Average Sales Price – Township

Monthly Sales By Property Type

Monthly Supply of Homes for Sale

Monthly Supply of Homes for Sale – By Property Type

Monthly Median Sales Price – By Property Type

Monthly Average Sales Price – By Property Type

Monthly Average Days on Market

Cornerstone Association of REALTORS® cautions that average sale price information can help identify long-term trends but should not be to indicate that specific properties have increased or decreased in value. The average sale price is calculated based on the total dollar volume of all properties sold. Months Supply is the inventory of homes for sale at the end of a given month, divided by the average monthly closed sales from the last 12 months. Those requiring specific information on property values should contact a Waterloo Region REALTOR®. REALTORS® have their fingers on the pulse of the market. They know the questions to ask, the areas to probe and what to look for so that you get a complete picture of the property and community you’re considering.

ABOUT CORNERSTONE

Cornerstone was formed on July 1, 2024, to better serve and represent REALTORS® in the markets of Mississauga, Burlington, Hamilton, Waterloo Region, Niagara North, Haldimand County, Norfolk County, and surrounding areas. With over 8,000 members, Cornerstone is Ontario’s second-largest REALTOR® association. Cornerstone stands for transparency, honesty, and integrity and offers a unique value proposition, paving the way for members’ brighter future.

Established to better serve and represent REALTORS®, its vision is to establish a new, more influential, capable, and member-centric organization designed to meet the evolving needs of REALTORS® and help them thrive in the marketplace.

Cornerstone stands for transparency, honesty, and integrity. By taking a proactive stance toward the future and not being afraid to question some of the long-standing assumptions, Cornerstone offers a unique value proposition, paving the way for members’ brighter future.

We are Cornerstone. REALTORS® Together, Stronger Together.

More information at www.cornerstone.inc 

The trademarks REALTOR®, REALTORS®, and the REALTOR® logo are controlled by The Canadian Real Estate Association (CREA) and identify real estate professionals who are members of CREA. The trademarks MLS®, Multiple Listing Service® and the associated logos are owned by The Canadian Real Estate Association (CREA) and identify the quality of services provided by real estate professionals who are members of CREA. Used under license.

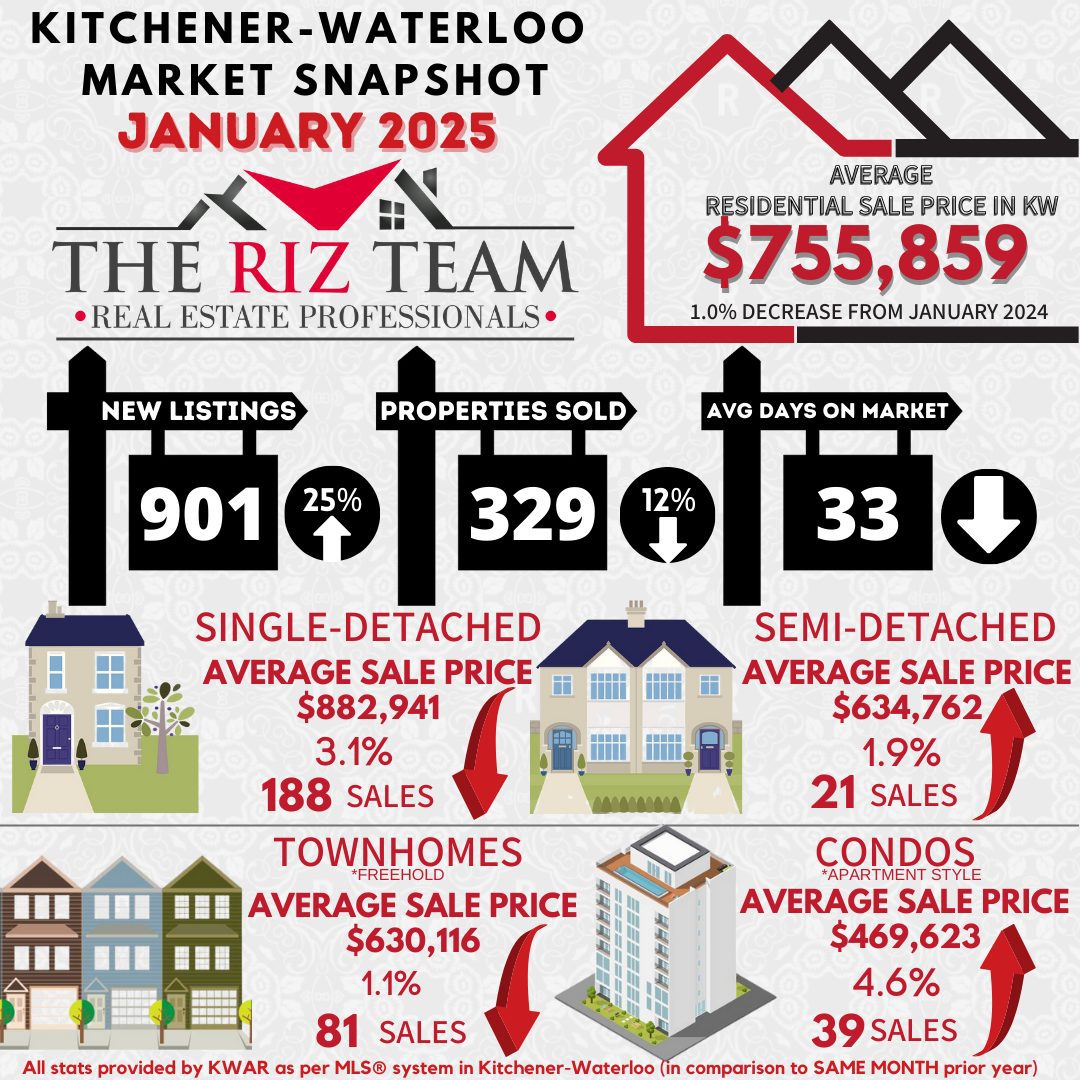
Kitchener Waterloo Market Snapshot January 2025

Wednesday, February 5th, 2025

Waterloo Region Housing Market Starts 2025 with Higher Inventory, Softer Sales

WATERLOO REGION, ON (February 5, 2025) —In January, a total of 329 homes were sold in the Waterloo Region via the Multiple Listing Service® (MLS®) System of the Cornerstone Association of REALTORS® (Cornerstone). This represents a 12.0 per cent decrease compared to the same period last year and a decline of 18.6 per cent compared to the average number of homes sold in the previous ten years for the same month.

“The Waterloo Region’s housing market shows promising dynamics as we begin 2025. With nearly 50 percent more active listings compared to last January and inventory levels well above the ten-year average, we’re seeing more choice for buyers in the market,” said Christal Moura, spokesperson for the Waterloo Region market. While sales have softened compared to last year, the increased inventory levels are creating more balanced conditions between buyers and sellers.

If you are considering to SELL your home or BUY a home in the next short while, 

it would be highly beneficial for you to connect with one of our Team Agents at

The Riz Team

Do you want to know what your home is worth today? Click Below for our Online No Obligation Market Evaluation:Click Here

Total residential sales in January included 188 detached homes (down 10.5 per cent from January 2024), and 81 townhouses (down 8.0 per cent). Sales also included 39 condominium units (down 30.4 per cent) and 21 semi-detached homes (up 5.0 per cent).

In January, the average sale price for all residential properties in Waterloo Region was $755,859. This represents a 1.0 per cent decrease compared to January 2024 and a 0.6 per cent decrease compared to December 2025.

  • The average price of a detached home was $882,941. This represents a 3.1 per cent decrease from January 2024 and a decrease of 1.2 per cent compared to December 2025.
  • The average sale price for a townhouse was $630,116. This represents a 1.1 per cent decrease from January 2024 and an increase of 0.1 per cent compared to December 2025.
  • The average sale price for an apartment-style condominium was $469,623. This represents a 4.6 per cent increase from January 2024 and a decrease of 1.2 per cent compared to December 2025.
  • The average sale price for a semi was $634,762. This represents a decrease of 1.9 per cent compared to January 2024 and a decrease of 1.6 per cent compared to December 2025.

Average Sale Price – Monthly

01_WaterlooRegionPriceChart_01.2025

CORNERSTONE cautions that average sale price information can help establish long–term trends but does not indicate specific properties have increased or decreased in value. The MLS® Home Price Index (HPI) provides the best way to gauge price trends because averages are strongly distorted by changes in the mix of sales activity from one month to the next.  

MLS® Home Price Index Benchmark Price

Kitchener-Waterloo Cambridge
Benchmark Type: January 2025 Monthly % Change Yr./Yr. % Change January 2025 Monthly % Change Yr./Yr. % Change
Composite $730,000 1.8 0.6 $747,300 3.1 0.0
Single Family $847,500 3.1 1.5 $787,400 3.8 1.2
Townhouse $590,100 -1.5 -2.0 $626,400 -0.6 -3.9
Apartment $430,600 -3.4 -4.2 $479,600 0.2 -2.3


January 2025 HPI image for stats release

“In an expected move, the Bank of Canada lowered its policy rate by 25 basis points to 3 per cent on January 29, 2025, helping to bring down the cost of borrowing. This reduction was welcome news for potential homebuyers,” says Moura. “However, with a potential trade war with the U.S. still looming, it’s difficult to predict what will happen when the Bank makes its next interest rate announcement on March 12.”

While the current economic uncertainty might make some house hunters hesitant, Moura highlights the new mortgage reforms that took effect in December. These changes make it easier to qualify for a mortgage with a down payment of less than 20 percent. Additionally, the insured mortgage cap increased from $1 million to $1.5 million, and all first-time buyers and those purchasing new builds will be eligible for 30-year amortizations, which will help reduce monthly payments.

There were 901 new listings added to the MLS® System in Waterloo Region last month, an increase of 25.0 per cent compared to January last year and a 27.6 per cent increase compared to the previous ten-year average for January.

The total number of homes available for sale in active status at the end of January was 1,296 an increase of 49.5 per cent compared to January of last year and 71.5 per cent above the previous ten-year average of 992 listings for January.

The total inventory across the market increased by 43.8 percent, resulting in a 2.3-month supply of all property types by the end of January. Condominium apartments had the highest inventory, with 5.1 months’ supply, followed by townhouses with 3.5 months’ supply and detached homes with 1.5 months’ supply. The number of months of inventory represents the time it would take to sell off current inventories at the current sales rate.

The average time to sell a home in January was 33 days, compared to 37 days in the previous month. In January 2024, it took 32 days for a home to sell, and the five-year average was 21 days.

Cornerstone emphasizes the importance of consulting a local REALTOR® when considering buying or selling property in the Waterloo Region. Their expertise can provide valuable insights into the current market conditions, enabling individuals to make well-informed decisions aligned with their goals and preferences.

View our HPI tool here to learn more: https://www.cornerstone.inc/stats/

Click on any of the graphs below for an interactive view.

Average Sales Price – Municipality

02_Average Sales Price by Municipality_01.2025

Average Sales Price – Township

03_Average Sale Prive by Township_01.2025

Monthly Sales By Property Type

04_Monthly Sales By Property Type_01.2025

Monthly Supply of Homes for Sale

05_Monthly Supply of Homes for Sale_01.2025

Monthly Supply of Homes for Sale – By Property Type

06_Monthly Supply of Homes for Sale - By Property Type_01.2025

Monthly Median Sales Price – By Property Type

07_Monthly Median Sales Price - By Property Type_01.2025

Monthly Average Sales Price – By Property Type

08_Monthly Average Sales Price - By Property Type_01.2025

Monthly Average Days on Market

09_Monthly Average Days on Market_01.2025

Cornerstone Association of REALTORS® cautions that average sale price information can help identify long-term trends but should not be to indicate that specific properties have increased or decreased in value. The average sale price is calculated based on the total dollar volume of all properties sold. Months Supply is the inventory of homes for sale at the end of a given month, divided by the average monthly closed sales from the last 12 months. Those requiring specific information on property values should contact a Waterloo Region REALTOR®. REALTORS® have their fingers on the pulse of the market. They know the questions to ask, the areas to probe and what to look for so that you get a complete picture of the property and community you’re considering.

ABOUT CORNERSTONE

Cornerstone Association of REALTORS® (Cornerstone) is a brand-new, novel association formed on July 1, 2024. Representing REALTORS® serving in the markets of Mississauga, Burlington, Hamilton, Waterloo Region, Niagara North, Haldimand County, Norfolk County and surrounding areas, it will become Ontario’s second-largest real estate board comprised of nearly 9,000 REALTORS®.

Established to better serve and represent REALTORS®, its vision is to establish a new, more influential, capable, and member-centric organization designed to meet the evolving needs of REALTORS® and help them thrive in the marketplace.

Cornerstone stands for transparency, honesty, and integrity. By taking a proactive stance toward the future and not being afraid to question some of the long-standing assumptions, Cornerstone offers a unique value proposition, paving the way for members’ brighter future.

We are Cornerstone. REALTORS® Together, Stronger Together.

More information at www.cornerstone.inc 

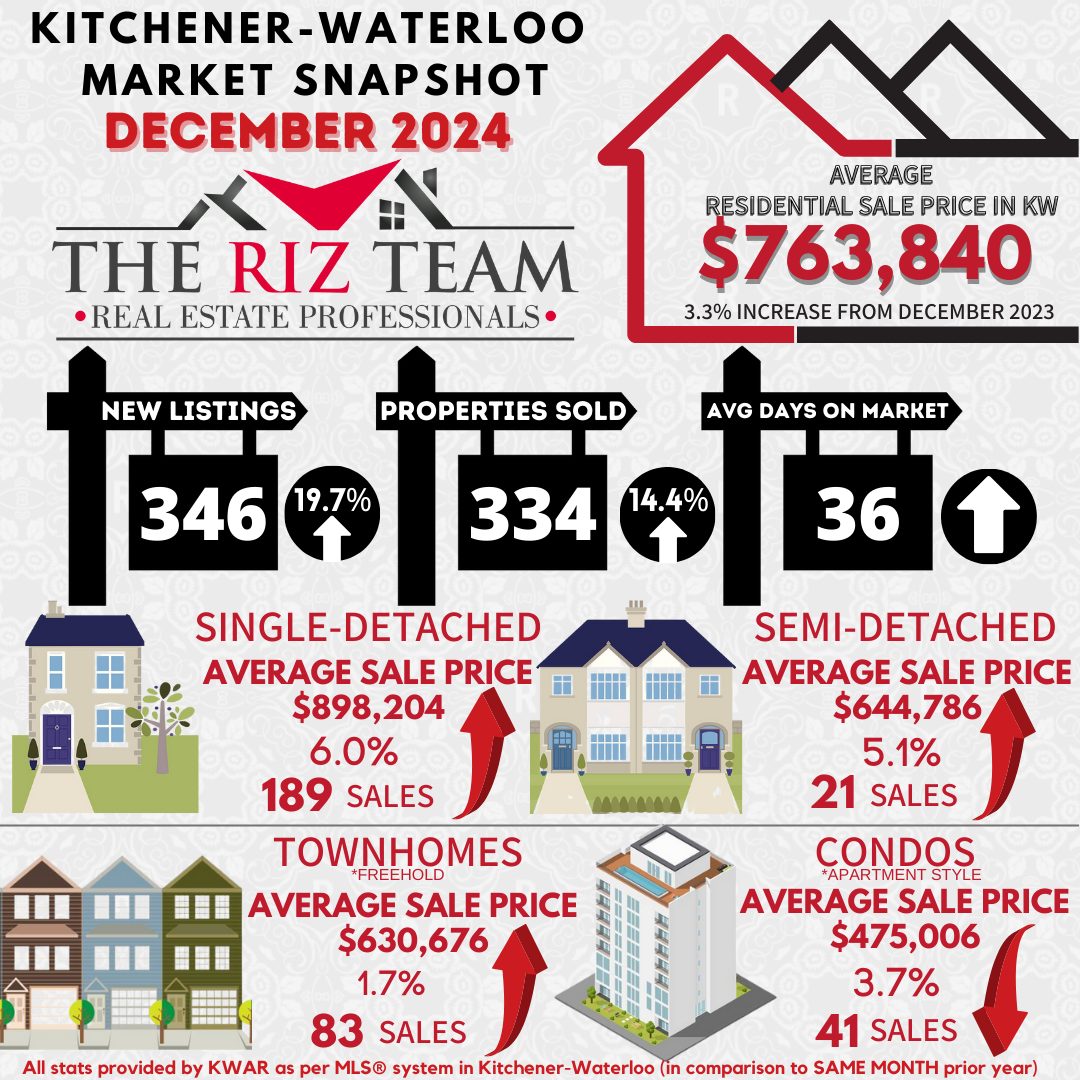
Kitchener Waterloo Market Snapshot December 2024

Tuesday, January 7th, 2025

Annual Home Sales in the Waterloo Region for 2024 saw a Slight Increase – December Home Sales a More Significant Boost

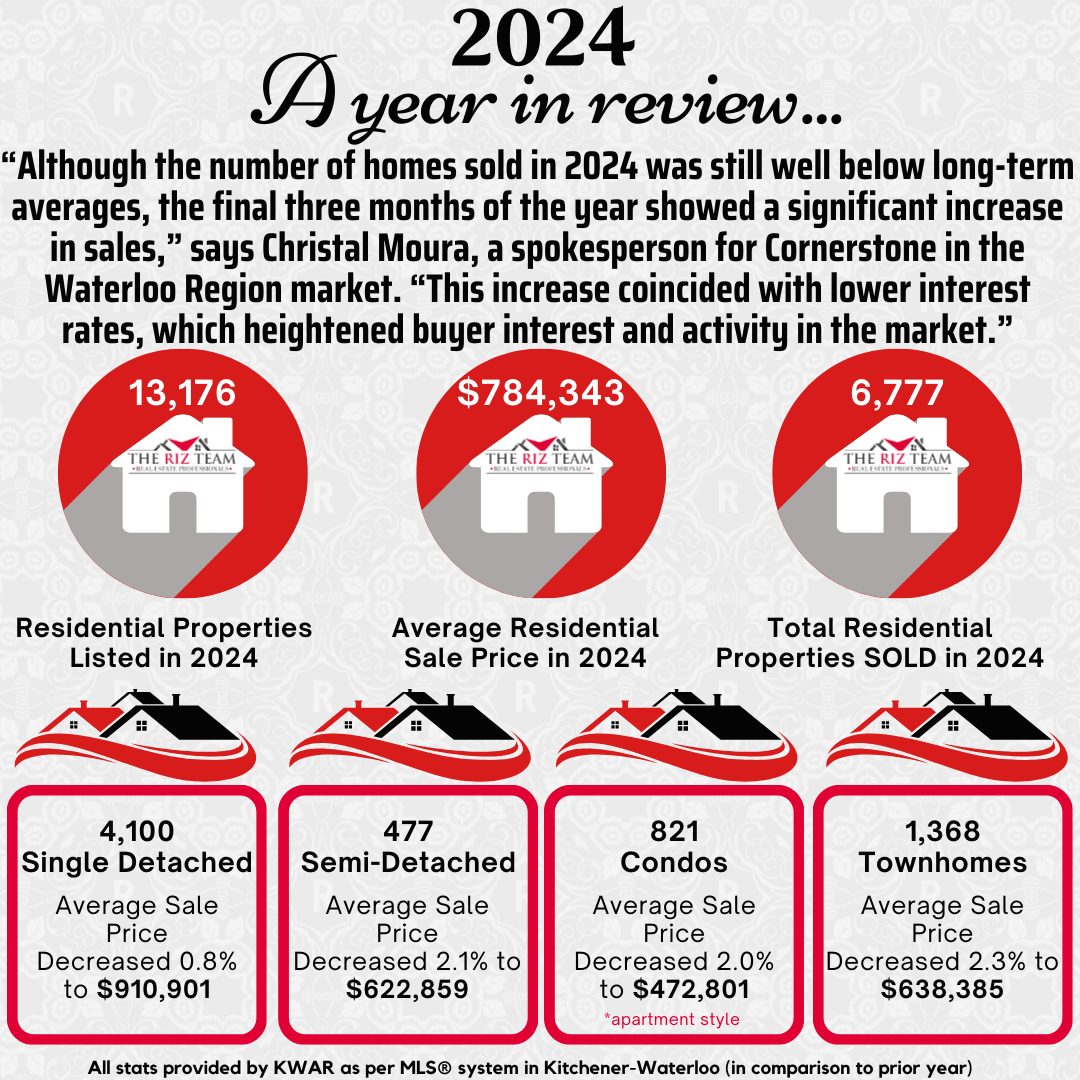
There were 6,777 homes sold through the Multiple Listing Service® (MLS®) System of the Cornerstone Association of REALTORS® (Cornerstone) in 2024, an increase of 2.8 per cent compared to 2023, and a decline of 18.9 per cent compared to the previous 5-year average for annual sales.

On a monthly basis, 334 homes were sold in December, an increase of 14.4 per cent compared to December 2023 and 9.9 per cent below the previous 5-year average for the month.

“Although the number of homes sold in 2024 was still well below long-term averages, the final three months of the year showed a significant increase in sales,” says Christal Moura, a spokesperson for Cornerstone in the Waterloo

Region market. “This increase coincided with lower interest rates, which heightened buyer interest and activity in the market.”

If you are considering to SELL your home or BUY a home in the next short while, 

it would be highly beneficial for you to connect with one of our Team Agents at


The Riz Team

Do you want to know what your home is worth today? Click Below for our Online No Obligation Market EvaluationClick Here

Total residential sales in December included 189 detached (up 8.0 per cent from December 2023), and 83 townhouses (up 48.2 per cent). Sales also included 41 condominium units (up 10.8 per cent) and 21 semi-detached homes (down 12.5 per cent).

For 2024, total residential sales included 4,100 detached (up 5.5 per cent), and 1,368 townhouses (up 2.6 per cent). Sales also included 821 condominium units (down 8.8 per cent) and 477 semi-detached homes (up 5.5 per cent).

In December, the average sale price for all residential properties in Waterloo Region was $763,840. This represents a 3.3 per cent increase compared to December 2023 and a 1.4 per cent increase compared to November 2024.

  • The average price of a detached home was $898,204. This represents a 6.0 per cent increase from December 2023 and an increase of 4.0 per cent compared to November 2024.
  • The average sale price for a townhouse was $630,676. This represents a 1.7 per cent increase from December 2023 and an increase of 2.7 per cent compared to November 2024.
  • The average sale price for an apartment-style condominium was $475,006. This represents a 3.7 per cent decrease from December 2023 and an increase of 5.5 per cent compared to November 2024.
  • The average sale price for a semi was $644,786. This represents an increase of 5.1 per cent compared to December 2023 and an increase of 0.2 per cent compared to November 2024.

Year-to-date, the average sale price for all residential properties in Waterloo Region decreased 0.3 per cent to $784,343 compared to 2023.

  • The year-to-date average price of a detached home was $910,901. This represents a 0.8 per cent decrease compared to 2023.
  • The year-to-date average sale price for a townhouse was $638,385. This represents a 2.3 per cent decrease compared to 2023.
  • The year-to-date average sale price for an apartment-style condominium was $472,801. This represents a 2.0 per cent decrease compared to 2023.
  • The year-to-date average sale price for a semi was $662,859. This represents a decrease of 2.1 per cent compared to 2023.

Monthly MLS® Home Price Index Benchmark Price

Kitchener-Waterloo Cambridge
Benchmark Type: December 2024 Monthly % Change Yr./Yr. % Change December 2024 Monthly % Change Yr./Yr. % Change
Composite $717,200 -0.4 0.6 $725,000 -1.7 2.4
Single Family $822,100 -0.8 1.9 $758,700 -2.1 4.1
Townhouse $599,000 1.1 -1.7 $630,300 0.6 -3.7
Apartment $445,600 0.3 -5.5 $478,600 -0.2 -4.0

Annual MLS® Home Price Index Benchmark Price

Kitchener-Waterloo Cambridge
Benchmark Type: 2024 Yr./Yr. % Change 2024 Yr./Yr. % Change
Composite $734,500 -2.6 $747,000 -1.0
Single Family $846,500 -1.3 $781,900 -0.5
Townhouse $612,900 -2.9 $646,600 -0.9
Apartment $451,200 -5.1 $491,000 0.8

“With the introduction of 30-year amortization options for all first-time homebuyers and new construction purchases now in effect as of December 15, 2024, along with an increased cap for insured mortgages now set at $1.5 million, I am optimistic that the housing market will become more accessible for aspiring homeowners in 2025,” says Moura.

There were 346 new listings added to the MLS® System in the Waterloo Region last month, an increase 19.7 per cent compared to December of last year and a 1.6 per cent increase compared to the previous ten-year average for December.

In 2024, 13,176 new listings were added to Cornerstone’s MLS® System in the Waterloo Region, an increase of 14.9 per cent compared to 2023, and a 10.8 per cent increase compared to the previous ten-year annual average.

The total number of homes available for sale in active status at the end of December was 1,092, an increase of 39.5 per cent compared to December of last year and 66.6 per cent above the previous ten-year average of 656 listings for December.

The number of months of inventory across the residential market is up 35.7 per cent compared to December of last year, now at 1.9 months. December’s rolling 12-month average was 2.6 months, which has risen from the 1.67 average of the past decade. In December, condominium apartments had the highest inventory, with 4.5 months’ supply, followed by townhouses with 2.7 months’ supply and detached homes with 1.3 months’ supply. The number of months of inventory represents the time it would take to sell off current inventories at the current sales rate

The average number of days to sell in December was 36, compared to 31 days in December 2023. The previous 5-year average is 23 days.

The average days to sell in 2024 was 23 days, compared to 19 days in 2023 and a previous 5-year average of 17 days.

Moura notes that supply conditions in the Waterloo region market area have improved over the past year. “With the possibility of the Bank of Canada further cutting its policy rate next year, this is encouraging news for buyers as we approach 2025,” she says.

Those requiring specific information on property values should contact a local REALTOR®. Working with a Realtor is the best way to get a complete picture of the property and community you are considering.

View our HPI tool here to learn more: https://www.cornerstone.inc/stats/

Cornerstone Association of REALTORS® cautions that average sale price information can help identify long-term trends but should not be to indicate that specific properties have increased or decreased in value. The average sale price is calculated based on the total dollar volume of all properties sold. Months Supply is the inventory of homes for sale at the end of a given month, divided by the average monthly closed sales from the last 12 months. Those requiring specific information on property values should contact a Waterloo Region REALTOR®. REALTORS® have their fingers on the pulse of the market. They know the questions to ask, the areas to probe and what to look for so that you get a complete picture of the property and community you’re considering.

ABOUT CORNERSTONE

Cornerstone Association of REALTORS® (Cornerstone) is a brand-new, novel association formed on July 1, 2024. Representing REALTORS® serving in the markets of Mississauga, Burlington, Hamilton, Waterloo Region, Niagara North, Haldimand County, Norfolk County and surrounding areas, it will become Ontario’s second-largest real estate board comprised of nearly 9,000 REALTORS®.

Established to better serve and represent REALTORS®, its vision is to establish a new, more influential, capable, and member-centric organization designed to meet the evolving needs of REALTORS® and help them thrive in the marketplace.

Cornerstone stands for transparency, honesty, and integrity. By taking a proactive stance toward the future and not being afraid to question some of the long-standing assumptions, Cornerstone offers a unique value proposition, paving the way for members’ brighter future.

We are Cornerstone. REALTORS® Together, Stronger Together.

More information at www.cornerstone.inc 


Kitchener Waterloo Market Snapshot November 2024

Wednesday, December 4th, 2024

November Home Sales in Waterloo Region Up Over Last Year

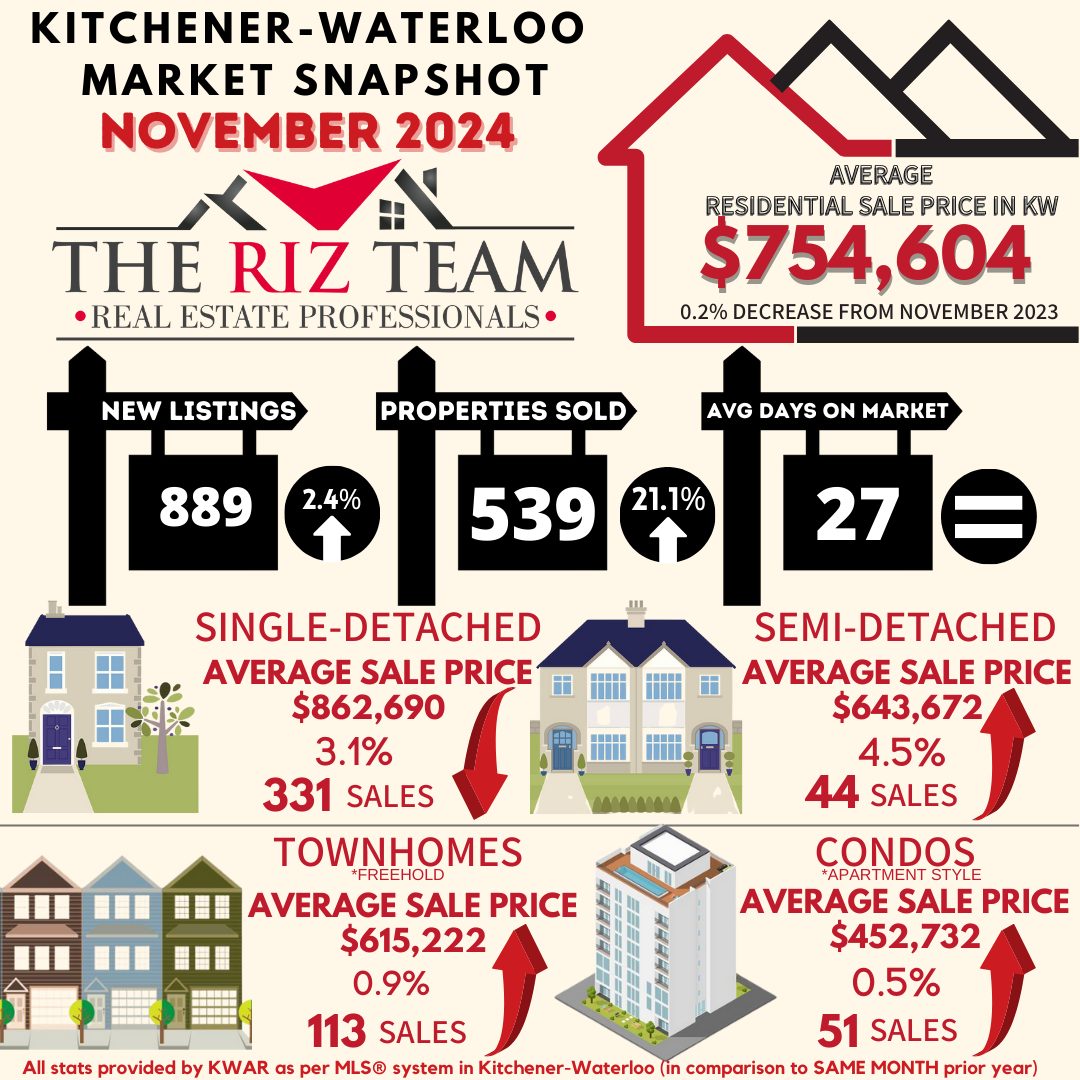
In November, a total of 539 homes were sold in the Waterloo Region via the Multiple Listing Service® (MLS®) System of the Cornerstone Association of REALTORS® (Cornerstone). This represents a 21.1 per cent increase compared to the same period last year and a decline of 13.1 per cent compared to the average number of homes sold in the previous ten years for the same month.

“Home sales in the Waterloo Region experienced a substantial increase in November compared to last year. However, sales were down from the previous month and remain below the historical averages for the area,” said Christal Moura, spokesperson for the Waterloo Region market. “November has shown more balanced conditions, and the increase in available homes has benefited buyers, giving them more options.”

If you are considering to Sell your home or Buy a home in the next short while it would be highly beneficial for you to connect with one of our Team Agents at


The Riz Team

Do you want to know what your home is worth today? Click Below for our Online No Obligation Market EvaluationClick Here

Total residential sales in November included 331 detached homes (up 23.5 per cent from November 2023), and 113 townhouses (up 37.8 per cent). Sales also included 51 condominium units (down 17.7 per cent) and 44 semi-detached homes (up 37.5 per cent).

In November, the average sale price for all residential properties in Waterloo Region was $754,604. This represents a 0.2 per cent decrease compared to November 2023 and a 3.3 per cent decrease compared to October 2024.

  • The average price of a detached home was $862,690. This represents a 3.1per cent decrease from November 2023 and a decrease of 2.6 per cent compared to October 2024.
  • The average sale price for a townhouse was $615,222. This represents a 0.9 per cent increase from November 2023 and a decrease of 4.9 per cent compared to October 2024.
  • The average sale price for an apartment-style condominium was $452,732. This represents a 0.5 per cent increase from November 2023 and a decrease of 6.2 per cent compared to October 2024.
  • The average sale price for a semi was $643,672. This represents an increase of 4.5 per cent compared to November 2023 and a decrease of 1.0 per cent compared to October 2024.

01.WaterlooRegionPriceChart_11.2024

MLS® Home Price Index Benchmark Price

  Kitchener-Waterloo Cambridge
Benchmark Type: November 2024 Monthly % Change Yr./Yr. % Change November 2024 Monthly % Change Yr./Yr. % Change
Composite $719,600 0.8 0.6 $737,400 -0.1 1.6
Single Family $828,900 0.9 2.1 $775,000 -0.1 3.3
Townhouse $592,300 -0.4 -4.9 $626,700 -0.3 -5.3
Apartment $444,300 1.1 -2.4 $479,600 -0.2 -3.3


November 2024 HPI image for stats release

“Current market conditions, marked by increased inventory and stable prices, suggest that now might be a good time to buy,” says Moura. “This is especially true for those who can take advantage of lower interest rates and recent mortgage reforms. These reforms expand eligibility for 30-year mortgage amortizations to all first-time homebuyers and buyers of new construction. Additionally, a higher limit on insured mortgages will take effect on December 15, 2024.”

There were 889 new listings added to the MLS® System in Waterloo Region last month, an increase of 2.4 per cent compared to November last year and an 18.4 per cent increase compared to the previous ten-year average for November.

The total number of homes available for sale in active status at the end of November was 1,565 an increase of 20.0 per cent compared to November of last year and 57.8 per cent above the previous ten-year average of 992 listings for November.

The total inventory across the market increased by 16.7 percent, resulting in a 2.8 month supply of all property types by the end of November. Condominium apartments had the highest inventory, with 5.9 months’ supply, followed by townhouses with 3.9 months’ supply and detached homes with 2.0 months’ supply. The number of months of inventory represents the time it would take to sell off current inventories at the current sales rate.

The average time to sell a home in November was 27 days, consistent with the previous month. In November 2023, it took 24 days for a home to sell, and the five-year average was 19 days.

Cornerstone emphasizes the importance of consulting a local REALTOR® when considering buying or selling property in the Waterloo Region. Their expertise can provide valuable insights into the current market conditions, enabling individuals to make well-informed decisions aligned with their goals and preferences.

View our HPI tool here to learn more: https://www.cornerstone.inc/stats/

02.Average Sales Price by Municipality_11.2024

03.Average Sale Price by Township_11.2024

04.Monthly Sales By Property Type_11.2024

05.Monthly Supply of Homes for Sale_11.2024

6.Monthly Supply of Homes for Sale – By Property Type_11.2024

07.Monthly Median Sales Price – By Property Type_11.2024

08.Monthly Average Sales Price – By Property Type.11.2024

09.Monthly Average Days on Market_11.2024

ABOUT CORNERSTONE

Cornerstone Association of REALTORS® (Cornerstone) is a brand-new, novel association formed on July 1, 2024. Representing REALTORS® serving in the markets of Mississauga, Burlington, Hamilton, Waterloo Region, Niagara North, Haldimand County, Norfolk County and surrounding areas, it will become Ontario’s second-largest real estate board comprised of nearly 9,000 REALTORS®.

Established to better serve and represent REALTORS®, its vision is to establish a new, more influential, capable, and member-centric organization designed to meet the evolving needs of REALTORS® and help them thrive in the marketplace.

Cornerstone stands for transparency, honesty, and integrity. By taking a proactive stance toward the future and not being afraid to question some of the long-standing assumptions, Cornerstone offers a unique value proposition, paving the way for members’ brighter future.

We are Cornerstone. REALTORS® Together, Stronger Together.

Kitchener Waterloo Market Snapshot October 2024

Monday, November 4th, 2024

Home Sales in the Waterloo Region Increased in October

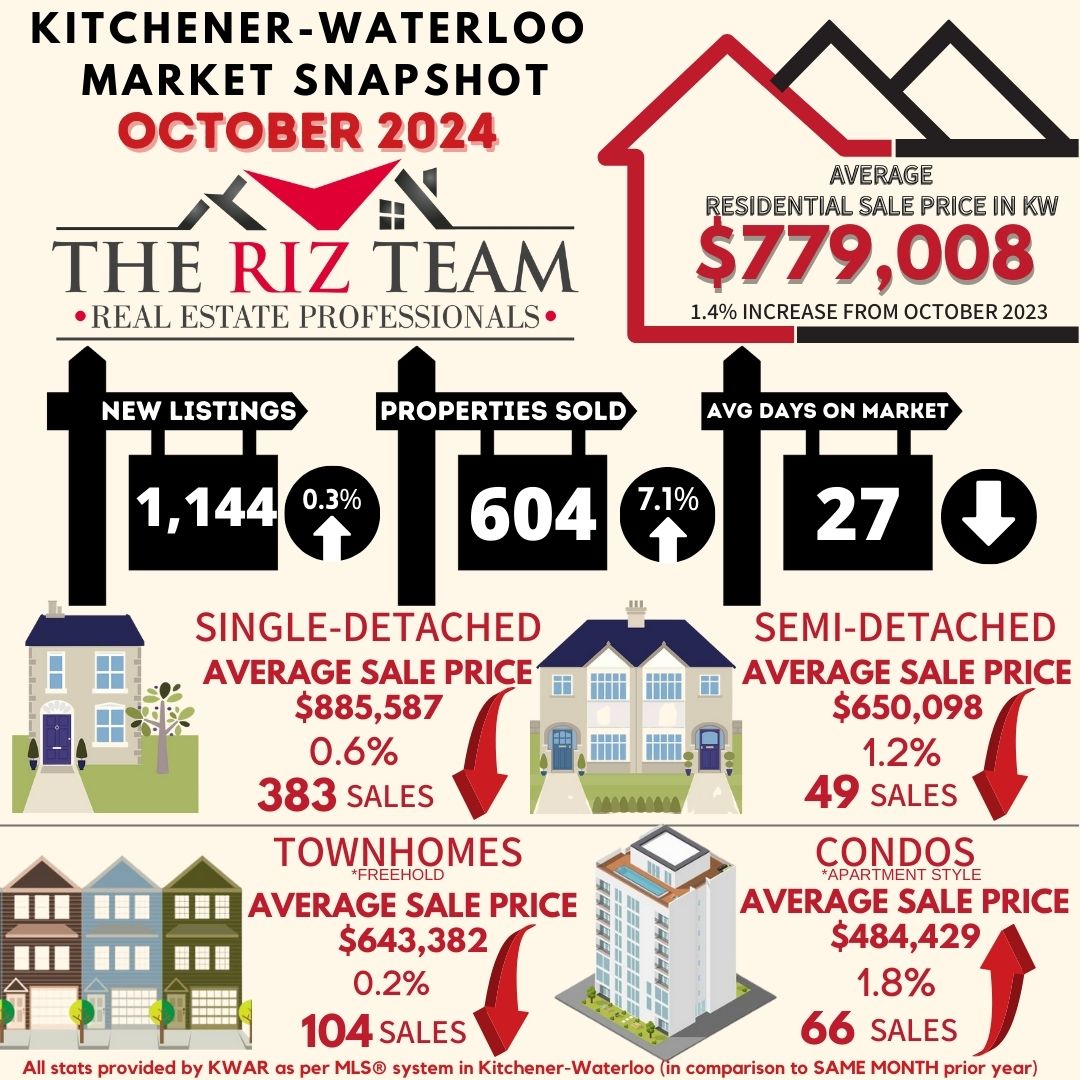
In October, a total of 604 homes were sold in the Waterloo Region via the Multiple Listing Service® (MLS®) System of the Cornerstone Association of REALTORS® (Cornerstone). This represents a 7.1 per cent increase compared to the same period last year and a decline of 14.2 per cent compared to the average number of homes sold in the previous ten years for the same month.

“For the first time since May, we witnessed an encouraging rise in home sales throughout Waterloo Region last month,” stated Christal Moura, spokesperson for the Waterloo Region market area. “This positive trend reflects a shift toward more balanced conditions within our housing market and a renewed confidence among buyers.”

If you are considering to Sell your home or Buy a home in the next short while it would be highly beneficial for you to connect with one of our Team Agents at


The Riz Team

Do you want to know what your home is worth today? Click Below for our Online No Obligation Market EvaluationClick Here

Total residential sales in October included 383 detached homes (up 15.4 per cent from October 2023), and 104 townhouses (down 20.0 per cent). Sales also included 66 condominium units (up 1.5 per cent) and 49 semi-detached homes (up 53.1 per cent).

In October, the average sale price for all residential properties in Waterloo Region was $779,008. This represents a 1.4 per cent increase compared to October 2023 and a 1.4 per cent decrease compared to September 2024.

  • The average price of a detached home was $885,587. This represents a 0.6 per cent decrease from October 2023 and a decrease of 2.9 per cent compared to September 2024.
  • The average sale price for a townhouse was $643,382. This represents a 0.2 per cent decrease from October 2023 and an increase of 7.8 per cent compared to September 2024.
  • The average sale price for an apartment-style condominium was $484,429. This represents a 1.8 per cent increase from October 2023 and a decrease of 0.2 per cent compared to September 2024.
  • The average sale price for a semi was $650,098. This represents a decrease of 1.2 per cent compared to October 2023 and a decrease of 0.7 per cent compared to September 2024.

Average Sale Price – Monthly

CORNERSTONE cautions that average sale price information can help establish longterm trends but does not indicate specific properties have increased or decreased in value. The MLS® Home Price Index (HPI) provides the best way to gauge price trends because averages are strongly distorted by changes in the mix of sales activity from one month to the next.  

MLS® Home Price Index Benchmark Price

Kitchener-Waterloo Cambridge
Benchmark Type: October 2024 Monthly % Change Yr./Yr. % Change October 2024 Monthly % Change Yr./Yr. % Change
Composite $713,800 -2.1 -2.5 $738,400 -0.5 -1.8
Single Family $821,900 -2.7 -1.1 $775,900 -0.2 -0.6
Townhouse $594,500 -1.4 -5.8 $628,500 -2.0 -5.9
Apartment $439,500 0.9 -5.7 $480,400 -0.2 -4.3


On Wednesday, October 23, Cornerstone welcomed the news that the Bank of Canada cut its policy rate by 50 basis points to 3.75 per cent. This marks the fourth consecutive rate cut since June and is the most substantial decrease since March 2020.  Moura commented, “The interest rate cuts are certainly beneficial for those with variable mortgages and encouraging news for homeowners facing mortgage renewals. However, I believe many prospective home buyers may continue to wait for more significant reductions before making a move, especially with the anticipated mortgage reforms that come into effect on December 15, 2024.”

There were 1,144 new listings added to the MLS® System in Waterloo Region last month, an increase of 0.3 per cent compared to October last year and a 19.9 per cent increase compared to the previous ten-year average for October.

The total number of homes available for sale in active status at the end of October was 1,711 an increase of 21.0 per cent compared to October of last year and 48.5 per cent above the previous ten-year average of 1,153 listings for October.

The total inventory across the market increased by 19.2 percent, resulting in a 3.1-month supply of all property types by the end of October. Condominium apartments had the highest inventory, with 5.5 months’ supply, followed by townhouses with 3.8 months’ supply and detached homes with 2.5 months’ supply. The number of months of inventory represents the time it would take to sell off current inventories at the current sales rate.

The average time to sell a home in October was 27 days, one day shorter than the previous month. In October 2023, it took 21 days for a home to sell, and the five-year average is 18 days.

Cornerstone emphasizes the importance of consulting a local REALTOR® when considering buying or selling property in the Waterloo Region. Their expertise can provide valuable insights into the current market conditions, enabling individuals to make well-informed decisions aligned with their goals and preferences.

Click on any of the graphs below for an interactive view.

Kitchener Waterloo Market Snapshot June 2024

Thursday, July 4th, 2024

Waterloo Region Housing Market Sees Cooling Trend: Increased Inventory and Lower Prices Provide Opportunities for Buyers

“The Waterloo Region housing market is cooling, with a year-over-year decrease in home sales in June, while the number of homes for sale is rising, offering more inventory to buyers,” says Christal Moura, Cornerstone spokesperson for the Waterloo Region market area.”


If you are considering to Sell your home or Buy a home in the next short while it would be highly beneficial for you to connect with one of our Team Agents at

The Riz Team

Do you want to know what your home is worth today? Click Below for our Online No Obligation Market EvaluationClick Here

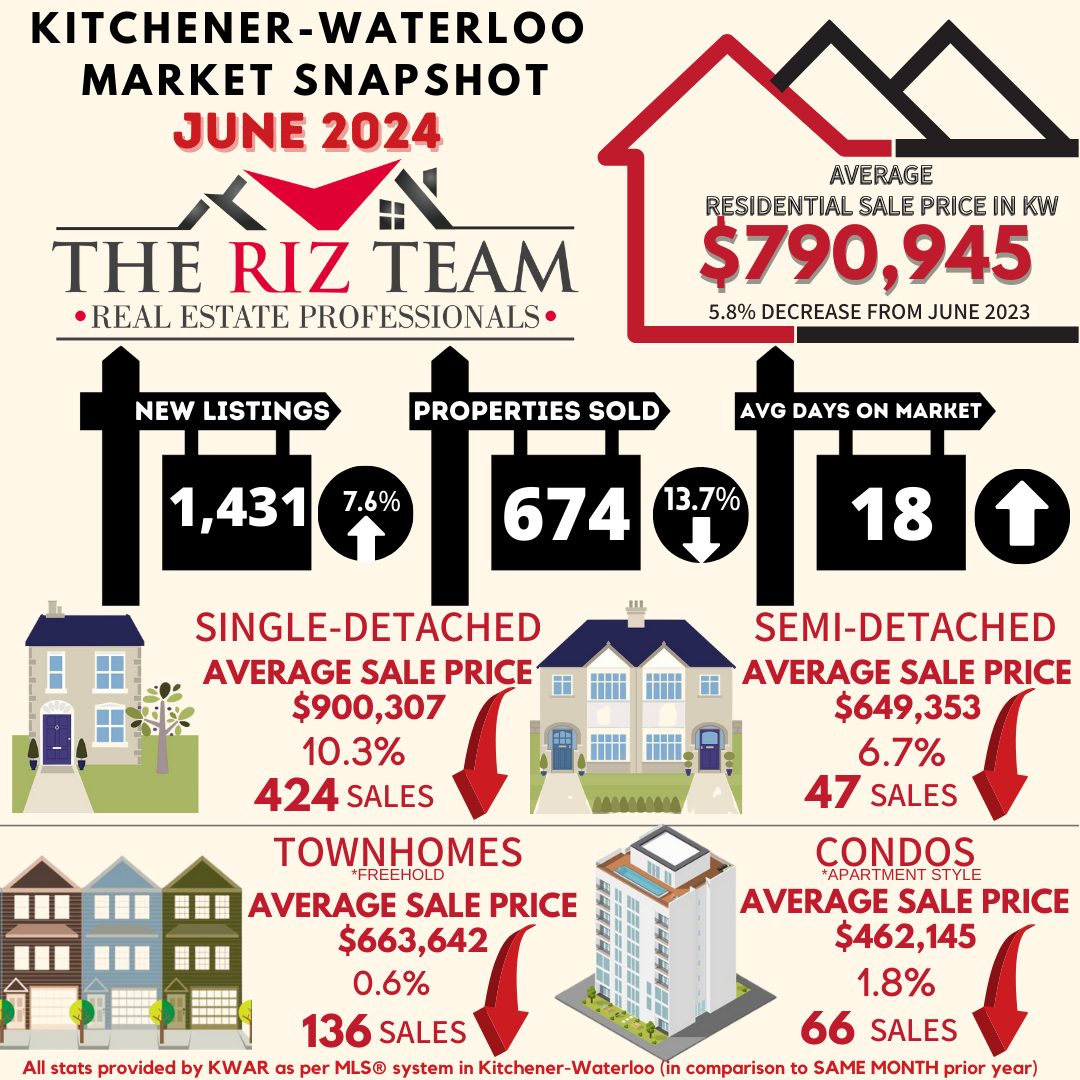
WATERLOO REGION, ON (July 4, 2024) —In June, a total of 674 homes were sold in the Waterloo Region via the Multiple Listing Service® (MLS®) System of the Cornerstone Association of REALTORS® (Cornerstone). This represents a decrease of 13.7 per cent compared to the same period last year and a decline of 24.8 per cent compared to the average number of homes sold in the previous ten years for the same month.

“The Waterloo Region housing market is cooling, with a year-over-year decrease in home sales in June, while the number of homes for sale is rising, offering more inventory to buyers,” says Christal Moura, Cornerstone spokesperson for the Waterloo Region market area.”

Total residential sales in June included 424 detached (down 9.6 per cent from June 2023), and 136 townhouses (down 8.7 per cent). Sales also included 66 condominium units (down 44.5 per cent) and 47 semi-detached homes (up 14.6 per cent).

In June, the average sale price for all residential properties in Waterloo Region was $790,945. This represents a 5.8 per cent decrease compared to June 2023 and a 3.3 per cent decrease compared to May 2024.

  • The average price of a detached home was $900,307. This represents a 10.3 per cent decrease from June 2023 and a decrease of 4.6 per cent compared to May 2024.
  • The average sale price for a townhouse was $663,642. This represents a 0.6 per cent decrease from June 2023 and an increase of 2.0 per cent compared to May 2024.
  • The average sale price for an apartment-style condominium was $462,145. This represents a decrease of 1.8 per cent from June 2023 and an increase of 0.5 per cent compared to May 2024.
  • The average sale price for a semi was $649,353. This represents a decrease of 6.7 per cent compared to June 2023 and a decrease of 7.2 per cent compared to May 2024.

06.2024-Average_Sales_Price-Monthly

MLS® Home Price Index Benchmark Price

Kitchener-Waterloo Cambridge
Benchmark Type: June 2024 Monthly % Change Yr./Yr. % Change June 2024 Monthly % Change Yr./Yr. % Change
Composite $741,500 -1.4 -5.6 $755,200 -0.7 -3.1
Detached $852,900 -1.6 -5.1 $791,900 -0.6 -3.1
Townhouse $626,400 -1.2 -3.9 $652,600 -0.7 -0.6
Apartment $455,800 -0.5 -4.7 $490,600 -1.1 1.6


June 2024 HPI Image for Stats Release


“The average selling price for residential properties has decreased by 5.8 per cent since June 2023, with detached homes showing the most significant drop at 10.3 percent. This indicates a broader softness in the market,” says Moura. “The silver lining is this presents a more favourable pricing environment for buyers, with more choices, greater flexibility, and the potential to negotiate better deals.”

There were 1,431 new listings added to the MLS® System in Waterloo Region last month, an increase of 7.6 per cent compared to June last year and a 10.6 per cent increase compared to the previous ten-year average for June.

The total number of homes available for sale in active status at the end of June was 1,790, an increase of 75.5 per cent compared to June of last year and 31.9 per cent above the previous ten-year average of 1,357 listings for June.

Market-wide inventory levels were up 73.7 per cent, with 3.3 months’ supply for all property types at the end of June. The property type that gained the most inventory was the condo apartment segment, which increased by 103.1 percent. That amounts to 6.5 months’ supply for condo apartments, 2.8 months for detached homes, and 3.2 months for townhouses.  The number of months of inventory represents the amount of time it would take to sell off current inventories at the current sales rate.

The average number of days to sell in June was 18, compared to 15 days in June 2023. The previous 5-year average is 15 days.

Cornerstone emphasizes the importance of consulting a local REALTOR® when considering buying or selling property in the Waterloo Region. Their expertise can provide valuable insights into the current market conditions, enabling individuals to make well-informed decisions aligned with their goals and preferences.

06.2024-Average_Sales_Price-By_Municipality

06.2024-Average_Sales_Price-By_Township

06.2024-Monthly_Sales_Pricy-bypropertytype


06.2024-Monthly_Supply_of_Homes_For_sale-bypropertytype

06.2024-Median_Sales_Price-By_Property_type

06.2024-Monthly_Average_Sales_Pricy-bypropertytype

06.2024-Monthly_Average_Days_on_Market

ABOUT CORNERSTONE

Cornerstone Association of REALTORS® (Cornerstone) is a brand-new, novel association formed on July 1, 2024. Representing REALTORS® serving in the markets of Mississauga, Burlington, Hamilton, Waterloo Region, Niagara North, Haldimand County, Norfolk County and surrounding areas, it will become Ontario’s second-largest real estate board comprised of nearly 9,000 REALTORS®.

Established to better serve and represent REALTORS®, its vision is to establish a new, more influential, capable, and member-centric organization designed to meet the evolving needs of REALTORS® and help them thrive in the marketplace.

Cornerstone stands for transparency, honesty, and integrity. By taking a proactive stance toward the future and not being afraid to question some of the long-standing assumptions, Cornerstone offers a unique value proposition, paving the way for members’ brighter future.

We are Cornerstone. REALTORS® Together, Stronger Together.

More information at www.cornerstone.inc 

Kitchener Waterloo Market Snapshot March 2024

Thursday, April 4th, 2024

Waterloo Region Home Sales Sluggish in March, Prices Steady

Despite the challenging market conditions, the first quarter of 2024 saw an increase in home sales, marking an 8.0 per cent rise compared to the previous year. However, these figures still fall short of the first-quarter sales of the past decade.  

“While home sales in Waterloo Region hit a record low for March in over two decades, we’re also witnessing a positive trend,” says Christal Moura, president of WRAR.  Over the past three months, prices and activity have started to pick up, and I expect this momentum will continue into the spring.”  

If you are considering to Sell your home or Buy a home in the next short while it would be highly beneficial for you to connect with one of our Team Agents at

The Riz Team

Do you want to know what your home is worth today? Click Below for our Online No Obligation Market EvaluationClick Here

WATERLOO REGION, ON (April 4, 2024) —In March, a total of 596 homes were sold via the Multiple Listing Service® (MLS®) System of the Waterloo Region Association of REALTORS® (WRAR). This represents a decrease of 3.2% compared to the same period last year and a decline of 33.4% compared to the average number of homes sold in the previous 5 years for the same month. 

Despite the challenging market conditions, the first quarter of 2024 saw an increase in home sales, marking an 8.0 per cent rise compared to the previous year. However, these figures still fall short of the first-quarter sales of the past decade. 

“While home sales in Waterloo Region hit a record low for March in over two decades, we’re also witnessing a positive trend,” says Christal Moura, president of WRAR.  Over the past three months, prices and activity have started to pick up, and I expect this momentum will continue into the spring.”    

Total residential sales in March included 344 detached (down 3.9 per cent from March 2023), and 127 townhouses (down 0.8 per cent). Sales also included 86 condominium units (down 1.1 per cent) and 37 semi-detached homes (down 11.9 per cent).  

In March, the average sale price for all residential properties in Waterloo Region was $806,279. This represents a 3.6 per cent increase compared to March 2023 and a 6.6 per cent increase compared to February 2024.  

  • The average price of a detached home was $954,342. This represents a 4.9 per cent increase from March 2023 and an increase of 7.3 per cent compared to February 2024.  
  • The average sale price for a townhouse was $667,810. This represents a 4.4 per cent increase from March 2023 and an increase of 6.0 per cent compared to February 2024.  
  • The average sale price for an apartment-style condominium was $483,085. This represents an increase of 0.3 per cent from March 2023 and an increase of 5.3 per cent compared to February 2024.  
  • The average sale price for a semi was $680,039. This represents a decrease of 2.9 per cent compared to March 2023 and an increase of 1.0 per cent compared to February 2024. 

March_Average_Sales_Price-By_Property_Type

MLS® Home Price Index Benchmark Price 

  Kitchener-Waterloo  Cambridge 
Benchmark Type:  March 2024  Monthly % Change  Yr./Yr. % Change  March 2024  Monthly % Change  Yr./Yr. % Change 
Composite  $740,900  1.6  0.0  $747,500  0.7  0.9 
Detached  $853,800  1.5  1.3  $780,100  0.8  1.1 
Townhouse  $614,900  2.3  1.3  $652,400  0.6  2.4 
Apartment  $461,900  2.1  -0.7  $490,500  2.8  3.4 

March 2024 HPI Image for STats Release

“Home prices have been gradually increasing since December, which is a typical trend,” explains Moura. “The rate and extent of further increases will depend on the willingness and patience of potential home buyers who have been waiting for lower interest rates before making their purchase. With the Bank of Canada not anticipated to make any rate changes before its June meeting, some potential home buyers may feel stuck in limbo.” 

The president of WRAR recommends that anyone interested in buying or selling a property in Waterloo Region seek advice from a local REALTOR® regarding the current market conditions. This will enable them to make an informed decision that aligns with their goals and priorities.  

There were 1,023 new listings added to the MLS® System in Waterloo Region last month, an increase of 18.7 per cent compared to March last year and a 15.9 per cent decrease compared to the previous ten-year average for March.  

The total number of homes available for sale in active status at the end of March was 1,081 an increase of 54.0 per cent compared to March of last year and 1.1 per cent below the previous ten-year average of 1,093 listings for March. 

At the end of March, there were 1.9 months of inventory, a 58.3 percent increase compared to last year and 18.8 percent above the previous 10-year average. The number of months of inventory represents how long it would take to sell off current inventories at the current sales rate.   

The average number of days to sell in March was 19, the same number as March 2023. The previous 5-year average is 18 days.   

These statistics provide a snapshot of the real estate market in the Waterloo Region in March, showing both positive and challenging aspects for buyers and sellers. WRAR encourages buyers to reach out to local Realtors for valuable insights about the current state of the local market and to receive tailored advice based on their specific needs. 

View our HPI tool here to learn more: https://wrar.ca/hpi/ 

Average Sales Price – Municipality

March_Average_Sales_Price-By_Property_Type

Average Sales Price – Township

March2024-Average_Sales_Price-By_Township

Monthly Sales By Property Type

March2024-Sales_by_Property_type

Monthly Supply of Homes for Sale

March2024-Supply_of_homes_for_sale

Monthly Supply of Homes for Sale – By Property Type

March2024-Supply_of_homes_for_sale-By_property-type

Monthly Median Sales Price – By Property Type

March2024-Median_Sales_Price-By_Property_Type

Monthly Average Sales Price – By Property Type

March2024-Average_Sales_Price-By_property_type

Monthly Average Days on Market

02.2024-Average_Days_on_Market

WRAR cautions that average sale price information can help identify long-term trends but should not be to indicate that specific properties have increased or decreased in value. The average sale price is calculated based on the total dollar volume of all properties sold. Months Supply is the inventory of homes for sale at the end of a given month, divided by the average monthly closed sales from the last 12 months. Those requiring specific information on property values should contact a Waterloo Region REALTOR®. REALTORS® have their fingers on the pulse of the market. They know the questions to ask, the areas to probe and what to look for so that you get a complete picture of the property and community you’re considering.

Kitchener Waterloo Market Snapshot & Yearly Summary December 2023

Friday, January 5th, 2024

Annual Home Sales Down Significantly in Waterloo Region in 2023

If you are considering to Sell your home or Buy a home in the next short while it would be highly beneficial for you to connect with one of our Team Agents at

The Riz Team

Do you want to know what your home is worth today? Click Below for our Online No Obligation Market EvaluationClick Here

WATERLOO REGION, ON (January 5, 2024) — There were 6,623 homes sold through the Multiple Listing Service® (MLS®) System of the Waterloo Region Association of REALTORS® (WRAR) in 2023, a decrease of 14.8 per cent compared to 2022, and a decline of 23.2 per cent compared to the previous 5-year average for annual sales.

On a monthly basis, there were 285 homes sold in December, a decrease of 0.7 per cent compared to December 2022, and 25.6 per cent below the previous 5-year average for the month.

“It should not be a surprise to anyone that for the second year in a row, the housing market in Waterloo Region has been affected by higher interest rates, resulting in a significant decline in annual sales,” says Christal Moura, President of WRAR. “This year’s sales reached their lowest point in over two decades.”

According to Moura, the trend observed in December reflects the overall slowdown in home sales throughout the year, with sales falling behind historical levels. The last time annual sales in Waterloo Region recorded fewer than 7,000 units was the year 2000.

Total residential sales in December included 172 detached (up 3.6 per cent from December 2022), and 54 townhouses (down 6.9 per cent). Sales also included 35 condominium units (up 2.9 per cent) and 24 semi-detached homes (down 4.0 per cent).

For 2023, total residential sales included 3,901 detached (down 17.0 per cent), and 1,339 townhouses (down 6.5 per cent). Sales also included 904 condominium units (down 9.2 per cent) and 457 semi-detached homes (down 26.6 per cent).

In December, the average sale price for all residential properties in Waterloo Region was $740,697. This represents a 2.8 per cent increase compared to December 2022 and a 2.1 per cent decrease compared to November 2023.

  • The average price of a detached home was $848,151. This represents a 2.6 per cent increase from December 2022 and a decrease of 4.7 per cent compared to November 2023.
  • The average sale price for a townhouse was $617,023. This represents a 0.8 per cent increase from December 2022 and an increase of 1.2 per cent compared to November 2023.
  • The average sale price for an apartment-style condominium was $490,816. This represents a 5.0 per cent increase from December 2022 and an increase of 9.0 per cent compared to November 2023.
  • The average sale price for a semi was $613,283. This represents a decrease of 0.5 per cent compared to December 2022 and a decrease of 0.5 per cent compared to November 2023.

Average Sale Price – Monthly

December Average Sales Price - By Property Type

On a year-to-date basis, the average sale price for all residential properties in Waterloo Region decreased 7.7 per cent to $786,033 compared to 2022.

  • The year-to-date average price of a detached home was $917,907. This represents a 6.1 per cent decrease compared to 2022.
  • The year-to-date average sale price for a townhouse was $653,138. This represents a 9.0 per cent decrease compared to 2022.
  • The year-to-date average sale price for an apartment-style condominium was $481,877. This represents a 9.0 per cent decrease compared to 2022.
  • The year-to-date average sale price for a semi was $677,831. This represents a decrease of 7.9 per cent compared to 2022.

Average Sales Price – Year-to-date

December Average Sales Price - By Property Type (Year-to-date)

WRAR cautions that average sale price information can be useful in establishing long-term trends but should not be used as an indicator that specific properties have increased or decreased in value. The MLS® Home Price Index (HPI) provides the best way to gauge price trends because averages are strongly distorted by changes in the mix of sales activity from one month to the next.

Monthly MLS® Home Price Index Benchmark Price

Kitchener-Waterloo Cambridge
Benchmark Type: December 2023 Monthly % Change Yr./Yr. % Change December 2023 Monthly % Change Yr./Yr. % Change
Composite $705,700 -0.4 -1.4 $706,800 -2.5 -0.4
Detached $798,100 -0.6 -0.9 $727,000 -2.9 -0.8
Townhouse $602,000 -2.2 0.0 $657,500 -1.2 3.8
Apartment $471,800 3.5 2.0 $497,700 1.1 1.6

Annual MLS® Home Price Index Benchmark Price


Kitchener-Waterloo

Cambridge

Benchmark Type: 2023 Yr./Yr. % Change 2023 Yr./Yr. % Change
Composite $746,600 -9.9 $753,500 -9.5
Detached $848,900 -8.5 $784,200 -9.1
Townhouse $624,200 -10.8 $655,600 -10.5
Apartment $475,500 -8.7 $485,900 -11.1


HPI_December2023(2)

“Waterloo Region’s slowing housing market echoes the overall slowdown we are seeing in the broader economy,” says Moura.”

There were 287 new listings added to the MLS® System in the Waterloo Region last month, a decrease of 6.2 per cent compared to December of last year and a 17.9 per cent decrease compared to the previous ten-year average for December.

In 2023, 11,528 new listings were added to WRAR’s MLS® System, a decrease of 14.4 per cent compared to 2022, and a 4.4 per cent decrease compared to the previous ten-year annual average.

The total number of homes available for sale in active status at the end of December was 779, an increase of 36.0 per cent compared to December of last year and 5.8 per cent above the previous ten-year average of 736 listings for December.

The number of months of inventory is up 55.6 per cent compared to December of last year, but still historically low at 1.4 months. Between 2010 and 2015, December’s rolling 12-month average was 3.5 months. The number of months of inventory represents how long it would take to sell off current inventories at the current sales rate.

The average number of days to sell in December was 30, compared to 25 days in December 2022. The previous 5-year average is 23 days.

The average days to sell in 2023 was 19 days, compared to 14 days in 2022 and a previous 5-year average of 18 days.

“While the dream of homeownership is alive, it is not quite well,” says Moura. “Housing continues to be less accessible to too many people in our region. This speaks to the pressing need for not just more housing to be built, but housing that spans all forms and economic strata, to ensure everyone has a suitable place to call home.”


Those requiring specific information on property values should contact a local REALTOR®. Working with a Realtor is the best way to get a complete picture of the property and community you are considering.

View our HPI tool here to learn more: https://wrar.ca/hpi/

Click on any of the graphs below for an interactive view.

December Average Sales Price_2023
December Average Sales Price- by township_2023
December Sales - By Property Type_2023
Months Supply of Homes for Sale_Dec2023
Median Sales Price - By Property Type _Dec2023
Average Sales Price - By Property Type_Dec23
Average Days on Market_Dec23
WRAR cautions that average sale price information can help identify long-term trends but should not be to indicate that specific properties have increased or decreased in value. The average sale price is calculated based on the total dollar volume of all properties sold. Months Supply is the inventory of homes for sale at the end of a given month, divided by the average monthly closed sales from the last 12 months. Those requiring specific information on property values should contact a Waterloo Region REALTOR®. REALTORS® have their fingers on the pulse of the market. They know the questions to ask, the areas to probe and what to look for so that you get a complete picture of the property and community you’re considering.

Kitchener Waterloo Market Snapshot November 2023

Tuesday, December 5th, 2023

Waterloo Region Home Sales Cool in November

This article will provide a comprehensive snapshot of the KW real estate market for October 2023.

“Last month, the number of homes sold followed their typical pattern of cooling to match the weather, but with consumer confidence continuing to drop, we saw sales slump to their lowest level for November in over a decade,” says Christal Moura, president of WRAR. “With many still waiting to see what happens with interest rates in the months to come, homes are taking a little longer to sell, there’s more inventory on the market, all contributing to sale prices levelling off.”

If you are considering to Sell your home or Buy a home in the next short while it would be highly beneficial for you to connect with one of our Team Agents at

The Riz Team

Do you want to know what your home is worth today? Click Below for our Online No Obligation Market EvaluationClick Here

WATERLOO REGION, ON (December 5, 2023) — In November, there were 441 homes sold through the Multiple Listing Service® (MLS®) System of the Waterloo Region Association of REALTORS® (WRAR), representing a decrease of 4.5 per cent compared to the previous year and a decline of 33.1 per cent compared to the previous 5-year average for the month.

“Last month, the number of homes sold followed their typical pattern of cooling to match the weather, but with consumer confidence continuing to drop, we saw sales slump to their lowest level for November in over a decade,” says Christal Moura, president of WRAR. “With many still waiting to see what happens with interest rates in the months to come, homes are taking a little longer to sell, there’s more inventory on the market, all contributing to sale prices levelling off.”

Total residential sales in November included 266 detached (down 6.7 per cent from November 2022), and 81 townhouses (no change). Sales also included 62 condominium units (up 5.1 per cent) and 31 semi-detached homes (down 16.2 per cent).

In November, the average sale price for all residential properties in Waterloo Region was $757,272. This represents a 2.6 per cent increase compared to November 2022 and a 1.4 per cent decrease compared to October 2023.

  • The average price of a detached home was $891,091. This represents a 5.8 per cent increase from November 2022 and on par with October 2023.
  • The average sale price for a townhouse was $611,667. This represents a 1.7 per cent decrease from November 2022 and a decrease of 5.1 per cent compared to October 2023.
  • The average sale price for an apartment-style condominium was $450,476. This represents a decrease of 1.3 per cent from November 2022 and a decrease of 5.4 per cent compared to October 2023.
  • The average sale price for a semi was $617,329. This represents a decrease of 3.9 per cent compared to November 2022 and a decrease of 6.2 per cent compared to October 2023.
November-Average-Sales-Price-By-Property-Type

WRAR cautions that average sale price information can be useful in establishing long-term trends but should not be used as an indicator that specific properties have increased or decreased in value. The MLS® Home Price Index (HPI) provides the best way to gauge price trends because averages are strongly distorted by changes in the mix of sales activity from one month to the next.

MLS® Home Price Index Benchmark Price

  Kitchener-Waterloo Cambridge
Benchmark Type: November 2023 Monthly % Change Yr./Yr. % Change November 2023 Monthly % Change Yr./Yr. % Change
Composite $708,600 -2.3 -0.6 $725,100 -3.5 -2.1
Detached $802,900 -2.4 0.9 $748,800 -3.9 -2.5
Townhouse $615,700 -1.3 1.0 $665,100 -0.9 3.1
Apartment $455,700 -2.3 -5.2 $492,300 -1.4 -0.9
November 2023 HPI Image for Stats Release

“Canadians are feeling the pinch of affordability, leading to price adjustments in the housing market of Waterloo Region,” says Moura.  “For prospective homebuyers, this slowdown presents an opportunity to enter the market during a less competitive phase and enjoy the advantages of homeownership in the long run.”

There were 868 new listings added to the MLS® System in Waterloo Region last month, an increase of 15 per cent compared to November last year and a 16.7 per cent increase compared to the previous ten-year average for November.

The total number of homes available for sale in active status at the end of November was 1,305 an increase of 54.8 per cent compared to November of last year and 21.0 per cent above the previous ten-year average of 1079 listings for November.

There were 2.4 months of inventory at the end of November, an 84.6 per cent increase compared to last year and 50.9 per cent above the previous 10-year average. The number of months of inventory represents how long it would take to sell off current inventories at the current sales rate.

The average number of days to sell in November was 24, compared to 22 days in November 2022. The previous 5-year average is 20 days.

These statistics provide a snapshot of the real estate market in the Waterloo Region in November, showing both positive and challenging aspects for buyers and sellers. WRAR encourages buyers to reach out to local Realtors for valuable insights about the current state of the local market and to receive tailored advice based on their specific needs.

View our HPI tool here to learn more: https://wrar.ca/hpi/

Click on any of the graphs below for an interactive view.

Average-Sales-Price-by-Municipality-Nov
Average-Sale-Price-by-Township-Nov
Monthly-Sales-By-Property-Type-Nov
Monthly-Supply-of-Homes-for-Sale-Nov
Monthly-Median-Sales-Price-By-Property-Type-Nov
Monthly-Average-Sales-Price-By-Property-Type-Nov
Monthly-Average-Days-on-Market-Nov

WRAR cautions that average sale price information can help identify long-term trends but should not be to indicate that specific properties have increased or decreased in value. The average sale price is calculated based on the total dollar volume of all properties sold. Months Supply is the inventory of homes for sale at the end of a given month, divided by the average monthly closed sales from the last 12 months. Those requiring specific information on property values should contact a Waterloo Region REALTOR®. REALTORS® have their fingers on the pulse of the market. They know the questions to ask, the areas to probe and what to look for so that you get a complete picture of the property and community you’re considering.


© Copyright 2017, Real Estate Websites by Redman Technologies Inc. | Privacy Policy | Disclaimer | Sitemap

MLS®, REALTOR®, and the associated logos are trademarks of The Canadian Real Estate Association.

The data included on this website is deemed to be reliable, but is not guaranteed to be accurate by the Kitchener-Waterloo Real Estate Board. The trademarks REALTOR®, REALTORS® and the REALTOR® logo are controlled by The Canadian Real Estate Association (CREA) and identify real estate professionals who are members of CREA. Used under license.