MOMENTOUS HOME SALES IN MARCH
Tuesday, April 4th, 2017
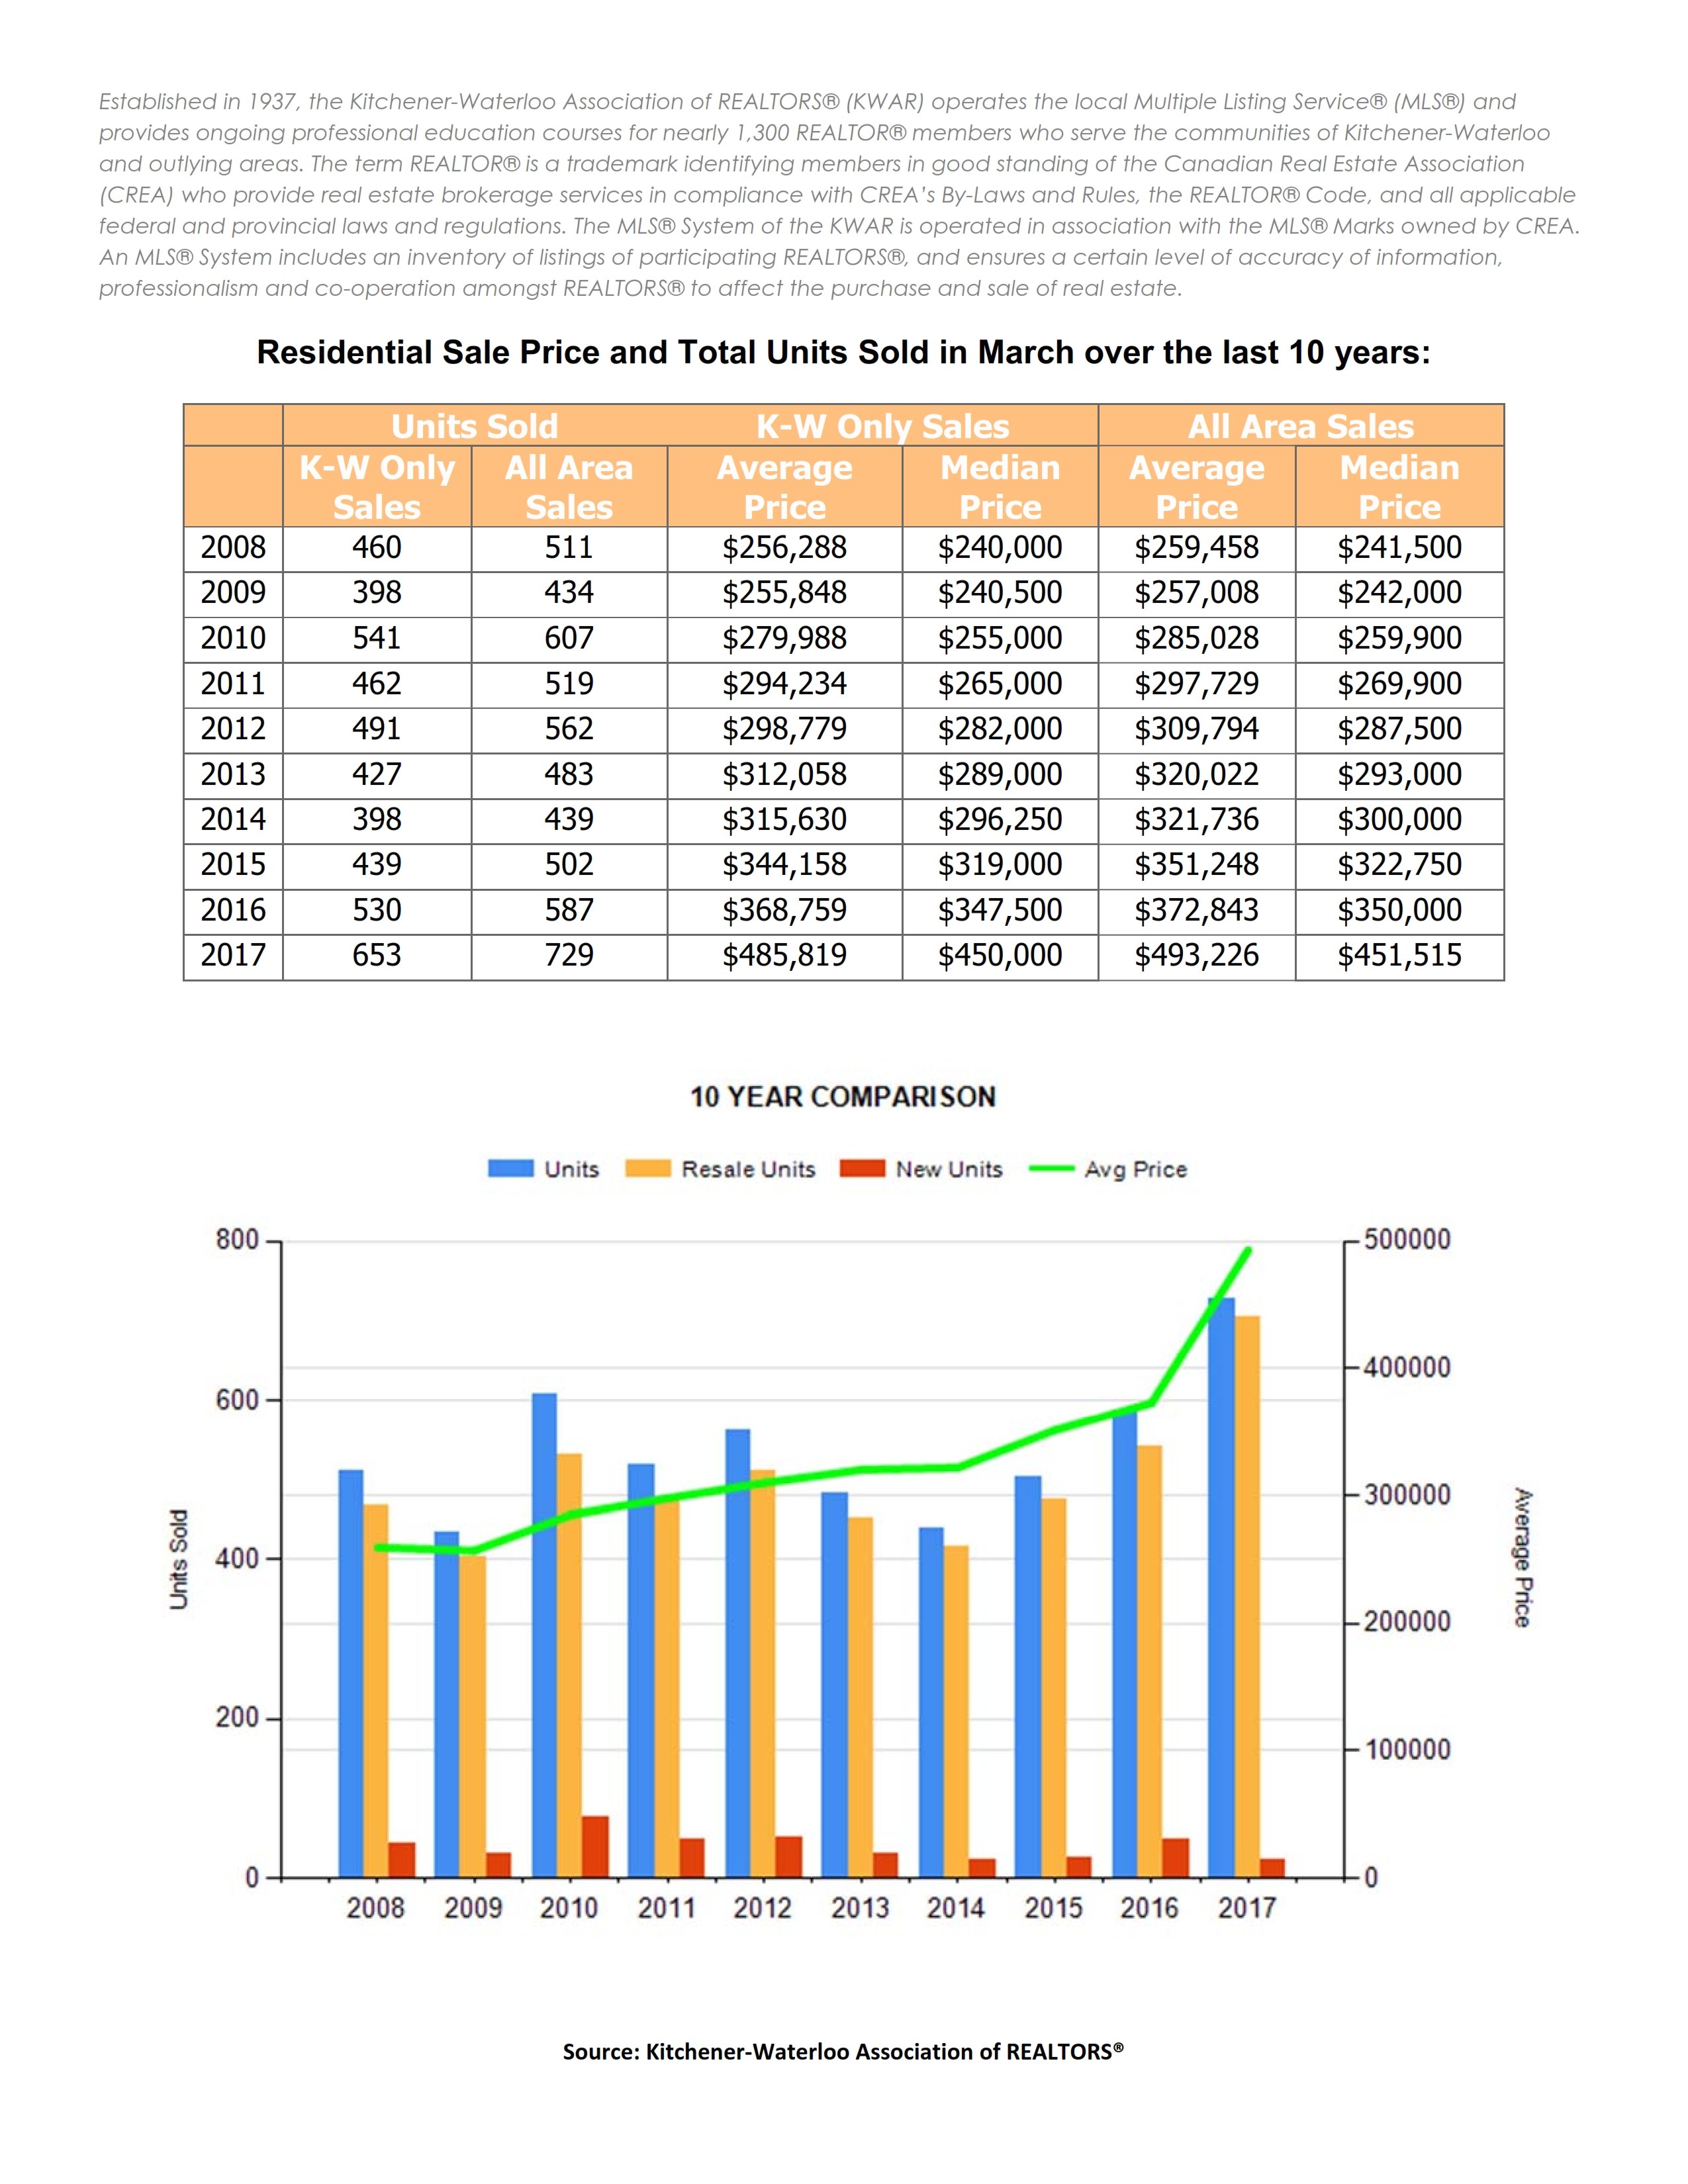
KITCHENER‐WATERLOO, ON (April 4, 2017) ––Residential sales through the Multiple Listing System (MLS® System) of the Kitchener‐Waterloo Association of REALTORS® (KWAR) continued their monthly ascent in March with 729 properties sold in Kitchener‐Waterloo and area. This represents a 24.2 percent increase compared to the same month last year, and is the highest March on record.
“This is the first time we’ve seen residential sales come anywhere close to the 700 unit mark so early in the year,” says James Craig, President of the KWAR. “These are exceptionally strong numbers, in fact’ we’ve only surpassed 700 units in a single month three other times: May 2007, and then not again until May and June of last year.”
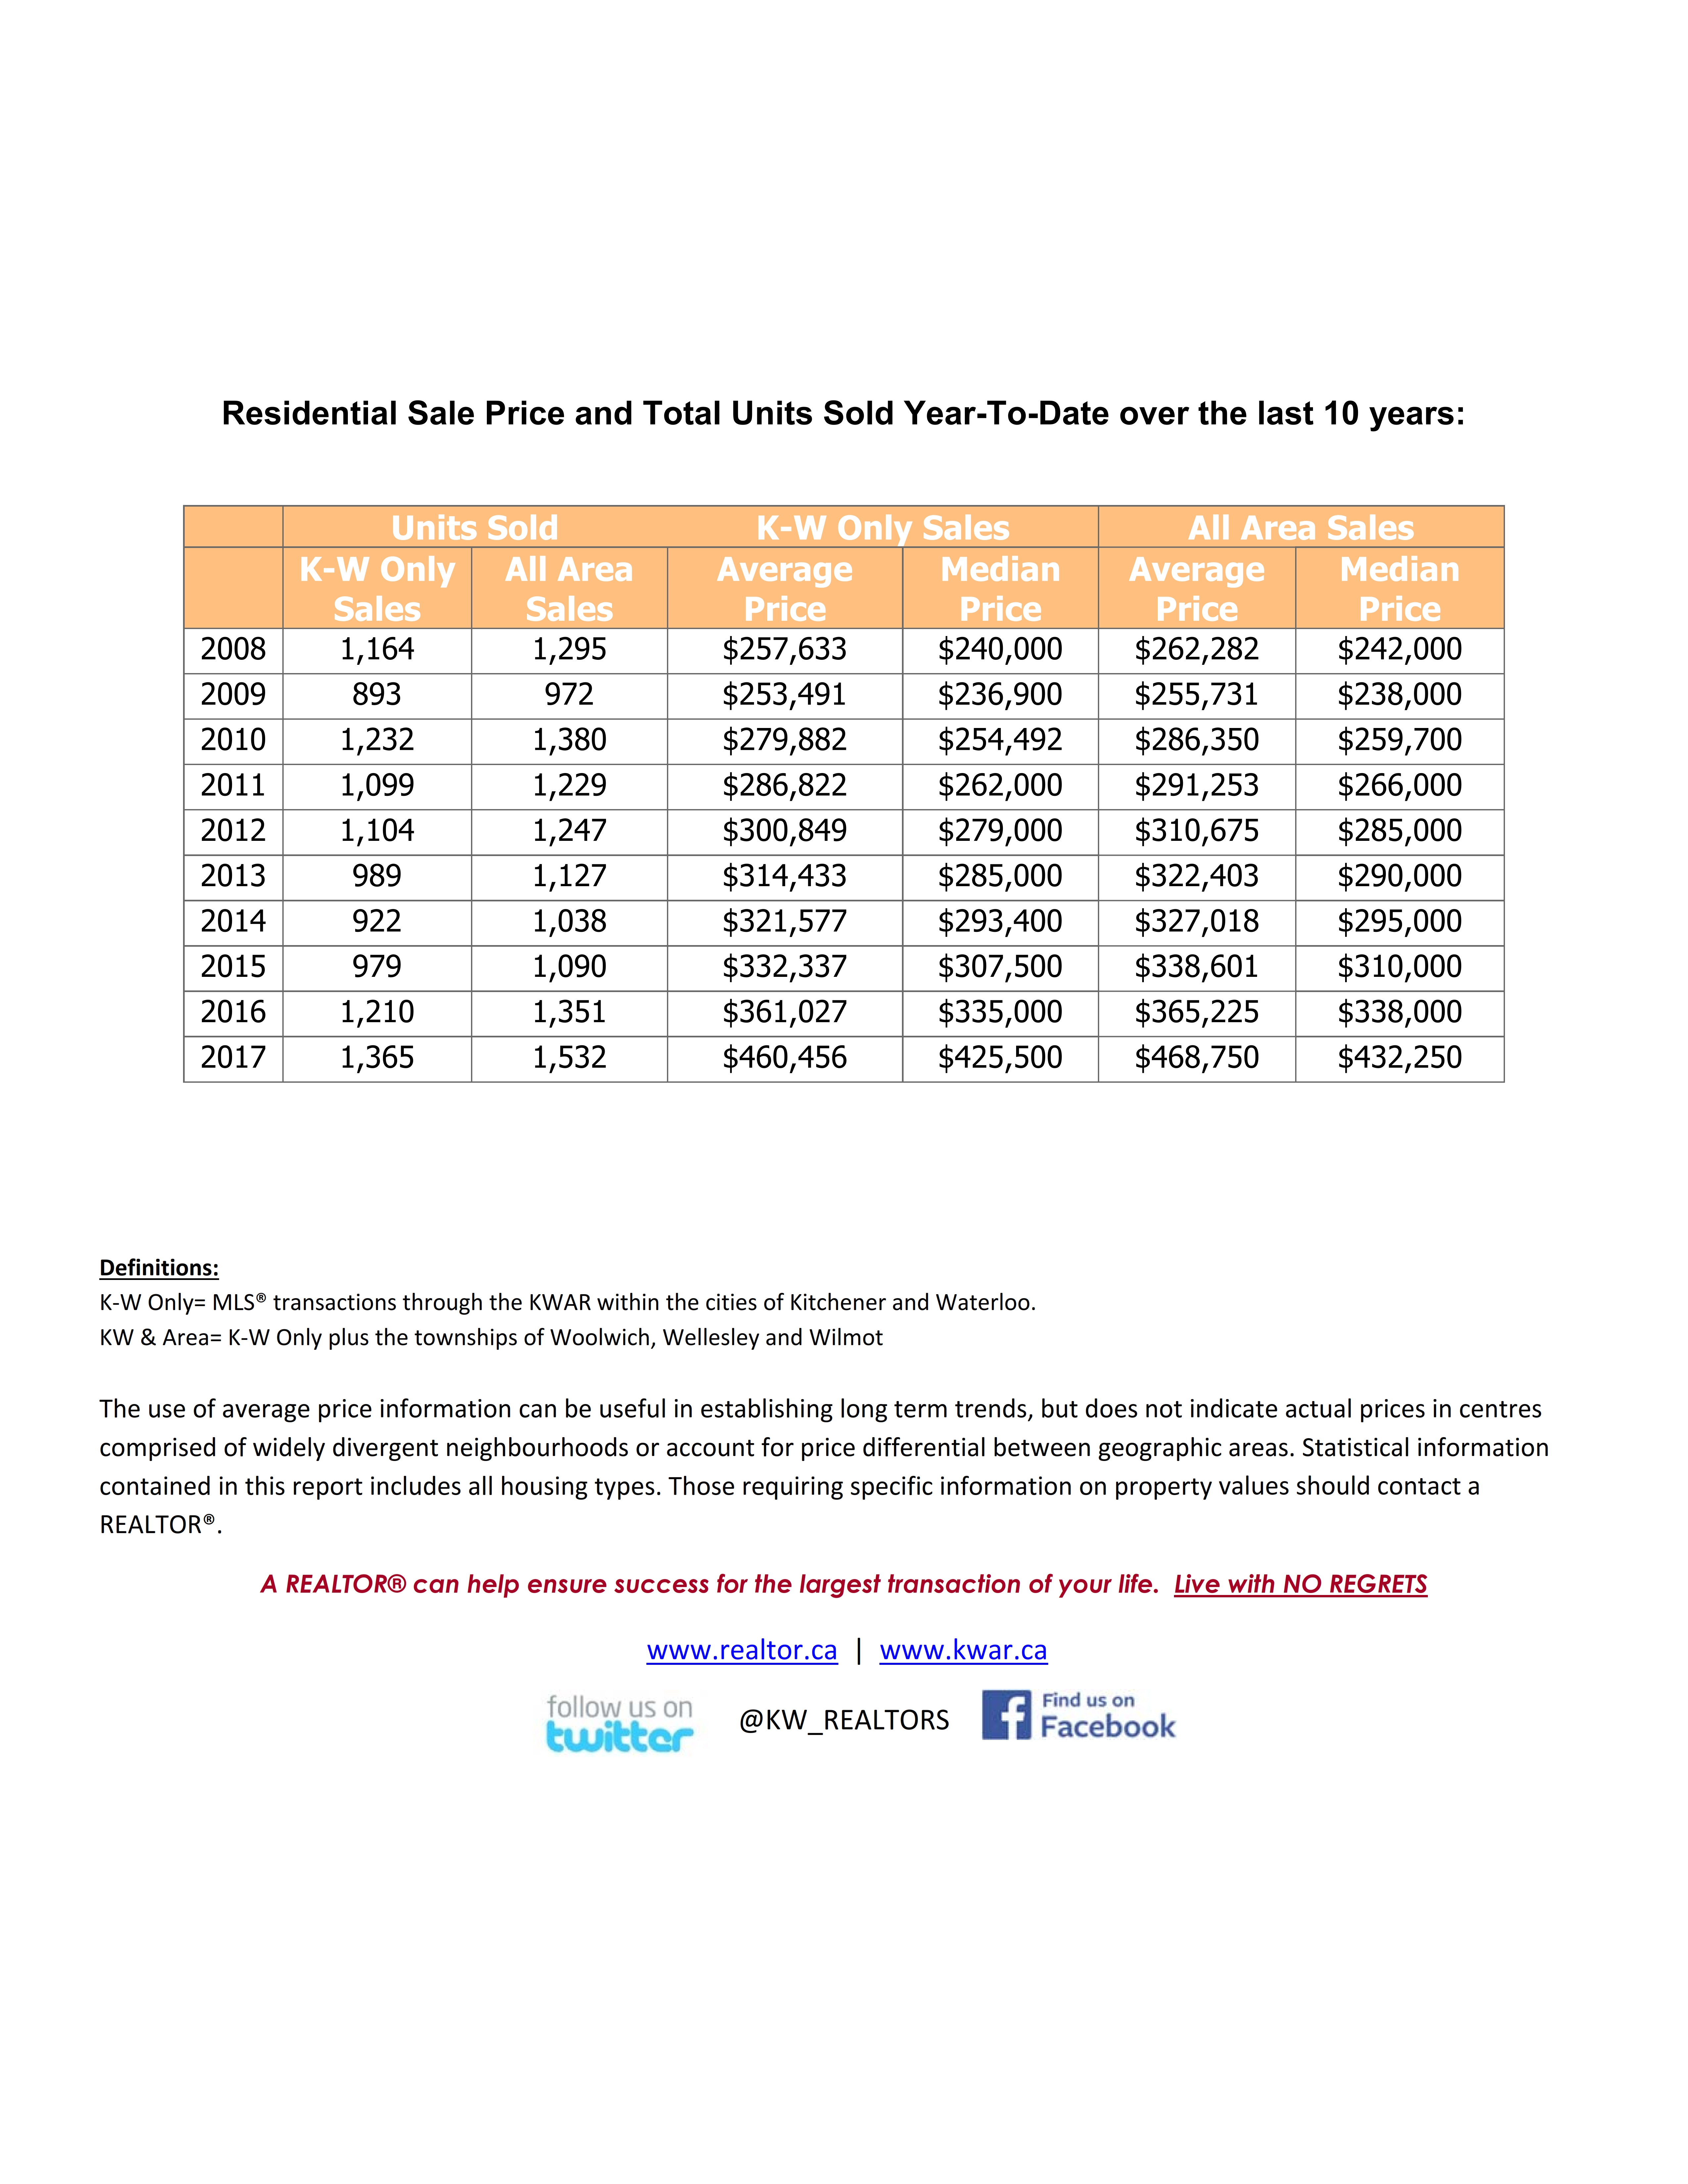
During the first quarter of 2017, there were 1,532 home sales, 13.4 percent above last year’s result for the same period and 30 percent above the previous 5‐year quarterly average. On a monthly basis, home sales were 41 percent above the previous 5‐year average for the month of March.
Residential sales in March included 444 detached homes (up 15.0 percent compared to March 2016), 164 condominium units (up 49.1 percent) which include any property regardless of style (i.e. semis, townhomes, apartment, detached etc.). Sales also included 67 semi‐detached homes (up 76.3 percent) and 48 freehold townhouses (up 14.3 percent).
The average sale price of all residential sales increased 32.3 percent to $493,226 compared to March 2016. Detached homes sold for an average price of $583,144 an increase of 35.6 percent, while the average sale price for an apartment style condominium was $265,524, an increase of 25.4 percent. Townhomes and semis sold for an average of $368,554 (up 29.9 percent) and $412,226 (up 49.1 percent) respectively.
Once again in their latest monthly news release, the Canadian Real Estate Association called the disparity between limited housing supply and robust demand in Ontario’s Greater Golden Horseshoe “without precedent”. In Kitchener‐Waterloo, the number of months of inventory has stood at or below one month for eight consecutive months.
Despite the low inventory, Craig notes that people were listing their homes in large numbers last month. “We had 844 new listings processed through our MLS® System in March which is above the previous 5‐year average of 807 for the month of March.” However, due to extraordinary demand, the number of active residential listings still on the market at the end of March was well below normal with only 434 residential properties for sale, way below the previous 5‐year March average of 1,508.
The average days on market in March were significantly shorter than a year ago: 14 days, compared to 35 days. On a month to month basis, it took four fewer days to sell a home in March compared to the month before.
“In the past several months there has been plenty of conversation in the media, in the pubs, and at all levels of government surrounding housing affordability, and it’s a concern I share,” says, Craig. “Earlier this month the Ontario Real Estate Association alongside the Ontario Home Builders’ Association called on the province to create a taskforce to address home affordability. While homeownership is an investment that has served most Canadians extremely well, it’s also becoming very difficult for those first‐time buyers who are trying to share in that dream and get into the market.”
The KWAR cautions that average sale price information can be useful in establishing long term trends, but should not be used as an indicator that specific properties have increased or decreased in value. The average sale price is calculated based on the total dollar volume of all properties sold. Those requiring specific information on property values should contact a local REALTOR®. REALTORS® have their fingers on the pulse of the market. They know the questions to ask, the areas to probe and what to look for so that you get a complete picture of the property and community you’re considering.

